-
See the figures below
(local link /
general link: moon_earthrise.html;
unlinked;
local link /
general link: earth/earth_blue_marble.html;
unlinked;
unlinked):
-
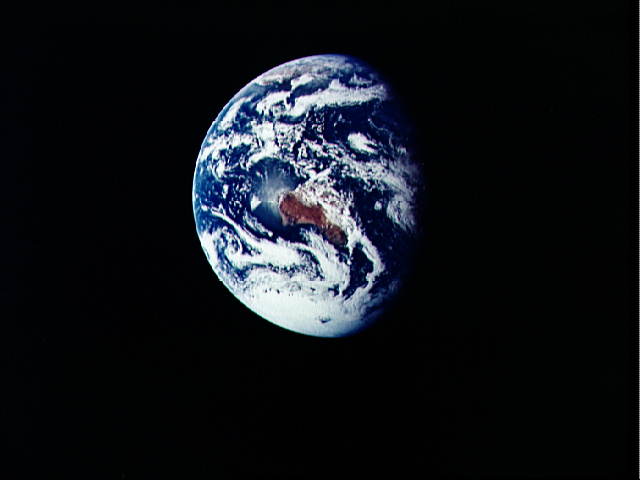 Caption: Earth from
Apollo 17,
1972
Dec07.
Caption: Earth from
Apollo 17,
1972
Dec07.
Credit/Permission: NASA, NASA: Image #AS17-148-22742, 1972 / Public domain.
Image link: Itself.
 Caption: North America
from Apollo 16,
1972
Apr16.
Caption: North America
from Apollo 16,
1972
Apr16.
You can see the Baja California Peninsula (which is about 1250 km long), the Rocky Mountains, and, towards the top, Lake Superior and Lake Michigan.
Credit/Permission: NASA, NASA: Image #AS16-118-18873, 1972 / Public domain.
Image link: Itself.
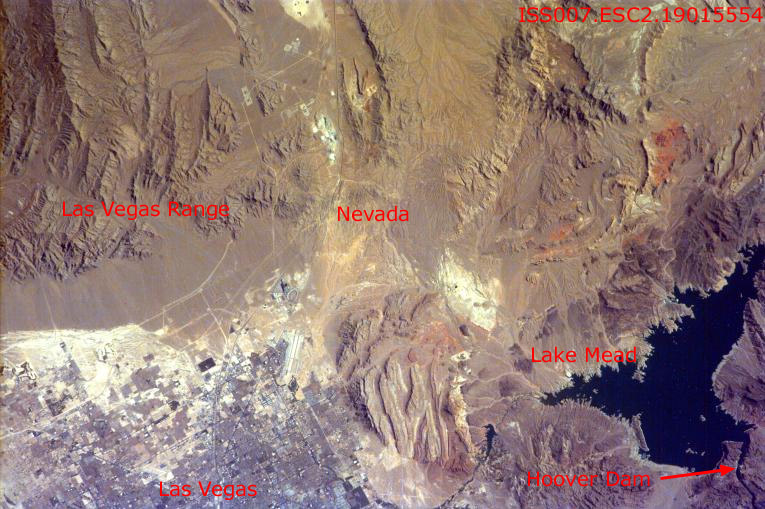 Caption: Las Vegas, Nevada.
North is to the upper left. The Las Vegas Wash pours into the leftmost corner of Lake Mead. The Highway 95 to the north-west is clear. Interstate 15 is probably the curve that streaks from the word Las Vegas up to the right and then more or less to the top middle. The University of Nevada, Las Vegas (UNLV) is probably off the picture south of the word Las Vegas.
The city looks like a grey mold spreading over the Mojave Desert.
Credit/Permission: NASA, NASA: ISS EarthKam, before or circa 2004 / Public domain.
Image link: Itself.
- After Effects - Earth Zoom Into San Francisco | 0:09: Not great. Short enough for the classroom.
- Earth Zoom Final | 0:26: Zoom in zu der Heimat. Not great. Short enough for the classroom.
- Zoom Into Earth | 0:34: Really into Hollywood. Not great. Short enough for the classroom.
- Earth | Time Lapse View from Space, Fly Over | NASA, ISS | 5:00: Pretty spectacular. A time-lapsed set of images from the International Space Station (ISS). The astronauts see the rolling by of the Earth much more slowly, and, of course, they don't see aurora and thunderstorms all the time. This is how Superman or Zeus might see the world---Superman's POV. Ordinarily too long for the classroom, but it might make a good opening or closing videos.
-
Earth zoom in videos
(i.e., Earth zoom in
videos):
Earth, the one and only.
All other planets are failed Earths.
-
To very good approximation the Earth is a
sphere---just shown by
The Blue Marble image.
- Peaks and Valleys:
There are mountains, valleys, and continents etc. due to geological processes that we will discuss, but the range from highest to lowest points is only about 20 km:
- Highest point:
Mount Everest rising to
8.84886 km above mean sea level
(see Wikipedia: Mount Everest).
See figure below.

Caption: "NASA pan photo mosaic of the Himilayas with Makalu and Mount Everest. The photo mosaic uses photos ISS008-E-13302 TO 13307 taken 2004 Jan28 taken from the International Space Station (ISS), Expedition 8 and added to The Gateway to Astronaut Photography. From The Gateway to Astronaut Photography of Earth." (Slightly edited.)
The image looks south from over the Tibetan Plateau. Makalu (8462 m, the 5th highest peak) is somewhere on left; Mount Everest (8850 m) somewhere on the right.
Credit/Permission: NASA, 2004 / Public domain.
Image link: Wikipedia.
See Mount Everest videos below/at link:
-
Mount Everest videos
(i.e., Mount Everest
videos):
- Mt Everest from Space | 0:42: From NASA. Not great, but short enough for the classroom.
- Lowest point: the Mariana Trench in the western Pacific Ocean dropping to 10.984 km below mean sea level (Wikipedia: Mariana Trench). See the diagram of the Mariana Trench in the figure below (local link / general link: mariana_trench.html).
- The Oblate Earth:
Additionally, the Earth (not counting the atmosphere for the moment) is slightly oblate (Cox-240) due to the centrifugal force. For further explication, see the figure below (local link / general link: earth_oblate_spheroid.html)
- The Spherical Earth and the Oblate Earth:
The Earth's modulations from sphericity are small as discussed above.
So basically the Earth is a sphere.
In any large scale images, differences from a sphere are unnoticeable.
Gravity has pulled it into this shape.
-
Question: What holds the Earth up from collapsing under its own
self-gravity?
- Gas pressure.
- The magnetic force of the Earth's magnetic field.
- The pressure force of the solid and fluid components of the Earth.
Answer 3 is right.An ideal fluid CANNOT resist a shearing force; it can only resist COMPRESSION. The Earth is NOT an ideal fluid, but under the weight of its own mass it acts approximately like a fluid in bulk.
The combination of self-gravity and pressure force results in the nearly spherical shape.
The solid and liquid pressure holds up the Earth's atmosphere too. The atmosphere is internally held up by its own gas pressure, of course.
Chemical bond forces of the rock and metals, the tidal forces of the Moon and Sun, and the centrifugal force provide only a bit of modulation from sphericity.
A fuller explanation of why sufficiently massive dense astro-bodies become approximately spherical is given in the figure below (local link / general link: hydrostatic_equilibrium_sphere.html).
-
Question: What is the
centrifugal force and how does it
affect the Earth's shape?
- The centrifugal force is
an ordinary force that turns on whenever
a system starts rotating relative to the
observable universe.
It tries to throw objects
straight outward from the axis of rotation.
The centrifugal force
of the Earth's
own rotation causes the Earth to be
oblate.
- The centrifugal force is
NOT an ordinary force.
It is an inertial force
present in frames rotating
relative to the
observable universe.
From an out perspective relative to
rotating frames,
the centrifugal force
can be viewed just as tendency of a body to move in a straight line.
But the gravitational force and
inertial forces in sufficiently
small regions are fundamentally identical---this is an axiom of
general relativity
(though here stated in loose way), and so
in yours truly's opinion
inertial forces are NOT
merely useful fictions, but real
forces---but NOT ordinary forces---and
they are very useful too.
The centrifugal force
of the Earth's
own rotation causes the Earth to be
oblate.
Answer 2 is right.The centrifugal force effect on Earth is relatively small.
It is much larger for Jupiter and Saturn which are distinctly oblate in some images.
See the false-color image of Saturn showing its oblateness in the figure below (local link / general link: saturn_oblate.html).
- The Earth's Mass and Density:
We can determine the mass of the Earth from the gravitation law and Newton's 2nd law (i.e., F=ma). For the calculation, see the figure below. (local link / general link: earth_mass.html).
We can calculate the Earth's mean density---which is a very, very cruel density---a shown in the figure below.
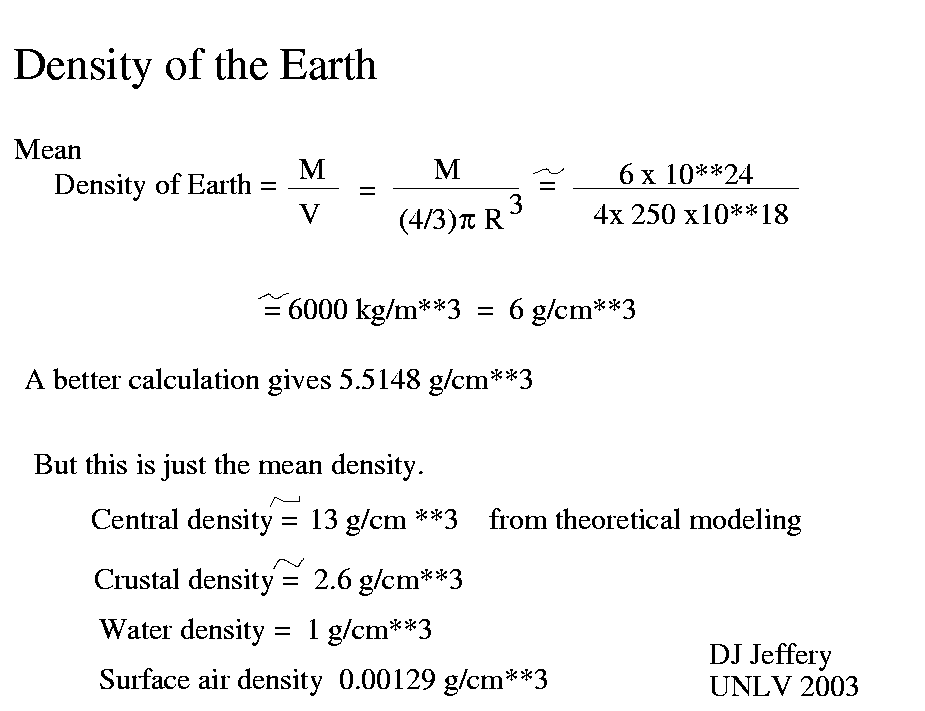
Caption: Determining the Earth's mean density.
Credit/Permission: © David Jeffery, 2003 / Own work.
Image link: Itself.
The mean density of 5.5148 g/cm**3 (Cox-240) is partially set by matter under strong compression in the deep interior.
From modeling, the uncompressed density of the Earth is estimated to be 4.2 g/cm**3 (Se-418). This is the density the Earth material would have if it were uncompressed.
The modeling involves the ingredients we discuss in the next section The Interior of the Earth: How We Know About It.
- Highest point:
Mount Everest rising to
8.84886 km above mean sea level
(see Wikipedia: Mount Everest).
See figure below.

-
As mentioned above, the deepest point on Earth
is the
Mariana Trench which reaches to
10.984 km below mean
sea level: the deepest place
on Earth
(Wikipedia: Mariana Trench).
- The Earth's Density:
The Earth's mean density is 5.5148 g/cm**3 (Cox-240). But the density of the surface material (mainly silicates) is of order 2.5--3 g/cm**3 (Cox-257).
Thus, there must be interior material that is denser (when uncompressed) or of compressed material. In fact, both conjectures are true: there is material denser when uncompressed, but it is also compressed to high density by weight of the overlying material.
The intrinsically denser materials that made up the newly formed hot and molten Earth sank and the intrinsically less dense materials rose and all this was due to the buoyancy effect.
This process is called chemical differentiation---which we discuss in IAL 10: Solar System Formation: Chemical Differentiation.
The buoyancy effect and "chemical differentiation" is illustrated in the figure below (local link / general link: buoyancy_cylinder.html).
- The Earth's Composition:
The Earth formed out of the primordial solar nebula whose composition is known from the solar photosphere composition and primitive meteorites.
This composition is believed to have been fairly uniform throughout the solar system before chemical differentiation and other processes caused composition variations to arise.
We know that the volatiles are depleted on Earth because they were never strongly condensed and/or escaped from the early hot Earth.
But what of the elements that stayed on Earth and chemically differentiated?
For example, consider the most abundant dense refractory element iron (Fe):
- The mean mass fraction of iron in
Earth's crust
is ∼ 5 %
(see Wikipedia: Crust: Composition).
- But the
primordial solar
nebula composition
(see the figure below:
local link /
general link: solar_composition.html)
has iron slightly more abundant
than silicon
which has mass fraction ∼ 27.7 % in the
Earth's crust
(see Wikipedia: Crust: Composition).
- Where Devil is the iron that was once part of the Earth's surface near the time of formation?
- Of course, the answer we already know. The denser substances mostly sank---like Satan never to hope again---during the chemical differentiation phase of the early molten Earth. Never to hope again: see the figure below (local link / general link: dore_satan.html).
- Thus, we infer that the core of the Earth must be mainly iron even though we've never seen a sample of it and won't probably ever.
- Uncompressed iron density is about 8 g/cm**3. The center density of the Earth from modeling is estimated to be 13 g/cm**3. The center pressure is modeled to be 3.6*10**6 atmospheres (Wikipedia: Inner core) which is about 3.6*10**6 times surface air pressure. Even iron compresses under such pressure.
- Where Devil is the iron that was once part of the Earth's surface near the time of formation?
- Seismology:
By studying the propagation of seismic waves from earthquakes plus modeling (i.e., by seismology), the interior structure of the Earth (including temperature, pressure, phase of matter) can be inferred.
The phase information is particularly interesting: the seismic wave study allows us to see where the interior is solid and where it is liquid.
See Seismic waves and earthquake videos below (local link / general link: seismic_wave_videos.html):
- EOF
- Heat Flow and Temperature in the Earth:
We can measure heat flow and temperature directly at the surface and to some depth (Wikipedia: Geothermal gradient).
- Other Evidences Too Numerous To Mention:
All kinds of other bits of evidence is used.
Among other things, the surface of the Earth is a boundary condition for the interior and it gives many constaints on interior conditions.
We have already noted some constraints: e.g., crustal composition.
- Modeling:
One has to construct computer models of the Earth that match the observations discussed in the subsection above.
Solving for the interior structure of the Earth is, in fact, an inverse problem where one must obtain the model parameters from the observational data. But it's NOT a simple inverse problem where one puts the data values into formulae and calculates the model parameters. It's one where you assume model parameters and calculate predictions and compare those to actual observations. Usually, an iteration is needed to bring the predictions into agreement with the observations.
Of course, the model parameters obtained are fits to the observations and are only meaningful to the degree that the model is an adequate simplified representation of the interior structure. If it's NOT an adequate representation, then the model parameters may NOT mean much.
Among other conditions imposed on the Earth model, the model must have hydrostatic equilibrium: i.e., the pressure at every radius must be able to hold up the mass of all above that radius from collapse under the Earth's self-gravity.
- The Earth's Composition:
The deepest drilling has only gone a few kilometers down---which is just scratching the surface on a planet with a mean radius of 6371.0 km. (see Wikipedia: Earth).
-
For the record, the record deepest drill is to 12.262 km below the surface
(see Wikipedia:
Extreme points of Earth: Lowest point (artificial)).
This understanding has had to be inferred from indirect evidence: density, primordial solar nebula composition, seismology, heat flow from the interior, mantle rock obducted into continental crust at convergent boundaries (AKA subduction zones) (see Wikipedia: Earth's mantle: Composition), other evidences (too numerous to mention), and modeling.
Let's detail the ingredients needed to understand the Earth's interior structure:
-
The result of all our
evidence and modeling
(as detailed above in
section The Interior of the Earth:
How We Know About It)
gives the Earth's interior structure
as made of layers:
the crust,
mantle,
liquid outer core,
and solid inner core.
- The lithosphere is the rigid
crust and upper
mantle down
to about 100 km
(Se-433).
The lithosphere material is relatively rigid.
Lithos means stone in
ancient Greek.
- The mantle below the
lithosphere
is the
asthenosphere.
The material of the
asthenosphere
is technically solid, but
it is sufficiently hot (i.e., more than 500 K:
Se-431) that it is rather plastic
(in the sense of being permanently deformable: see
Wikipedia: Plasticity)
and flows over long periods of time.
These layers are shown in the figure below.
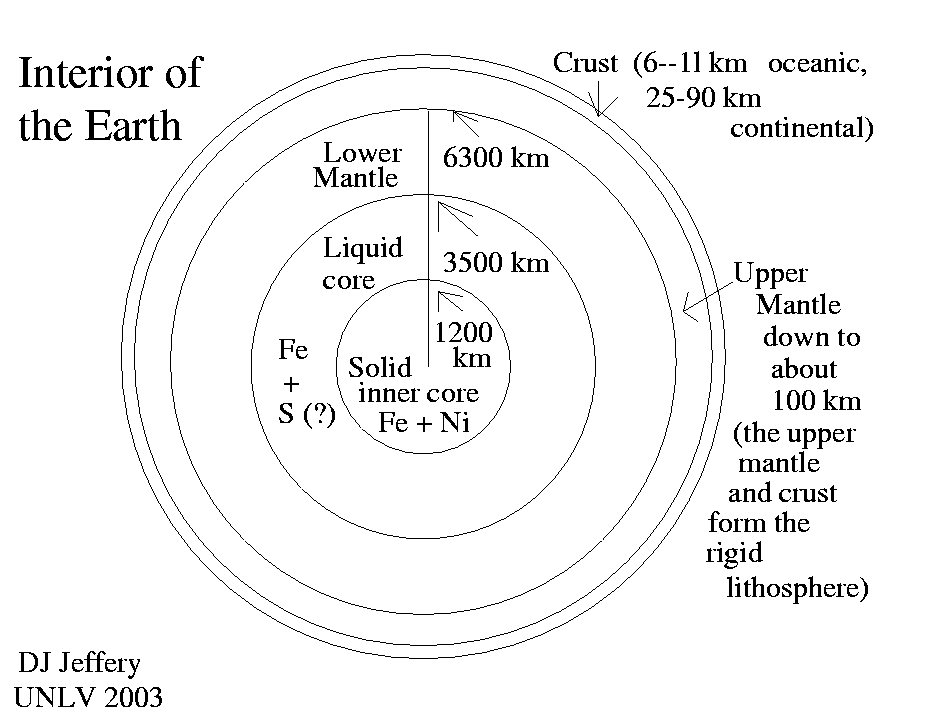
Caption: A cartoon of the interior structure of the Earth (HI-118; Ze2002-160).
My cartoon is from before or circa 2010 and is slightly dated.
An analysis from 2013, suggests that sulfur (S) is probably NOT a main component of the Earth's core (see Lidunka Vocadlo, 2013, Earth science: Core composition revealed, Nature).
It is now thought that oxygen (O) and silicon (Si) are the main components after iron (Fe) (approximately 80 % by mass) and nickel (Ni) (approximately 10 % by mass)
The liquid outer core may be about 10 % by mass O and Si and the solid inner core maybe about 3 % by mass O and Si.
Why were the lighter elements NOT excluded from the Earth's core by chemical differentiation?
Chemical differentiation isn't a perfect process. Some chemical chemical bonding may always keep some elements stuck together to some degree depending on the situation.
Credit/Permission: ©
David Jeffery,
2003 / Own work.
Image link: Itself.
The inner core is hotter than the outer core, but is a solid because the higher pressures near the center favor the solid phase.
Solid-state physicists can measure or calculate melting temperatures under high pressure.
The temperature and density profiles of the Earth can be calculated too. See the two figures below (unlinked; local link / general link: earth_density_distribution.html).
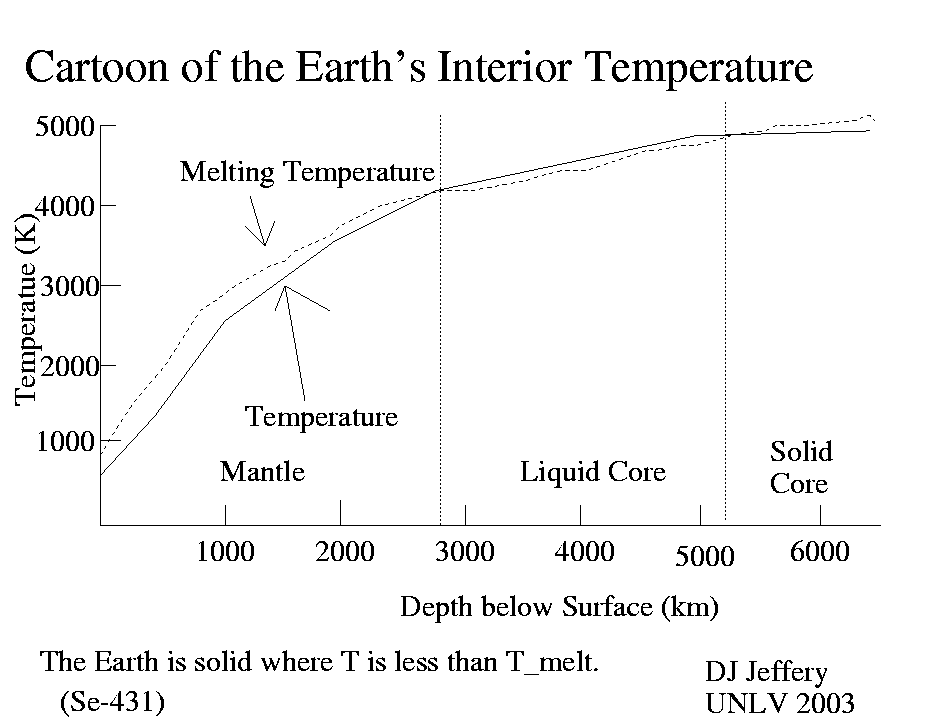
Caption: A cartoon of the Earth's interior temperature profile from modeling (Se-431).
Credit/Permission: ©
David Jeffery,
2003 / Own work.
Image link: Itself.
The crust by direct inspection is mostly
silicates:
i.e., rock composed
mainly of silicon (Si)
and oxygen (O) plus some amounts of all other
refractories and
volatiles that are locked up in the rock.
The densities are 2.5--3.5 g/cm**3
(Se-431).
The crust
is given in the figure below
(local link /
general link: earth_crust_composition.html).
The mantle is also mainly
silicates by INFERENCE
with density varying
over the range 3.5--5.8 g/cm**3
(Se-431).
The silicates
are believed to be richer in
magnesium and iron than the
crust
(CW-52).
The solid inner core and liquid outer core are probably mainly iron, but significant nickel (Ni), oxygen (O), and silicon (Si) are also present as discussed above.
There is also a second layering classification: lithosphere and asthenosphere:
-
Group Activity:
Form groups of 2 or 3---NOT more---and tackle Homework 11 problems 2--10 on the Earth's structure.
Discuss each problem and come to a group answer.
Let's work for 5 or so minutes.
See Solutions 11.
The winners get chocolates.
- Heat Flow from the Sun:
The atmospheric temperature, most??? of the oceanic temperature, and the very thin uppermost continental ground temperature are determined by electromagnetic radiation (EMR) from the Sun (which becomes heat energy) and the greenhouse effect---which we discuss below in the section The Greenhouse Effect.
The electromagnetic radiation (EMR) flux above the atmosphere impinging on the Earth is on average 1367.6 W/m**2 (see NASA Earth fact sheet).
-
Question: What is this EMR
flux from the Sun above the
atmosphere called?
- The solar constant.
- The solar variable.
- The solar wind.
Answer 1 is right, but as we saw in IAL 8: The Sun, the solar constant does vary.The solar constant is defined to be the flux at the mean orbital radius of the Earth, and so does NOT have variation due to the eccentricity of the Earth's orbit. That variation is quite large, but averages out over a year.
-
The solar flux (power per unit area)
received at the top of the
Earth's atmosphere.
varies over about 6.9% during a year
from a low of 1321 W/m**2 in circa Jul05
when Earth is farthest from the
Sun
to 1412 W/m**2 in circa Jan03
when Earth
is closest to the Sun
(Wikipedia Solar Constant;
Wikipedia: Earth's orbit: Events in the orbit).
But once the very short-time variations (due to sunspots mainly???) have been smoothed away the solar cycle variations are only of order 0.1 %.
Of course, very long term variations exist. Over centuries and over gigayears. Recall the Sun is has probably brightened by 30 % since 4.6 Gyr ago will probably brighten by 30 % more in the next 3.5 Gyr (WB-106).
The solar constant flux is captured by the Earth's circular cross-sectional area of pi*R**2 where R is the Earth's radius (Wikipedia: Sphere).
But to get the average energy flux at the top of the atmosphere, one must spread the captured power over the whole spherical surface area of 4*π*R**2 (Wikipedia: Sphere).
So the average flux at the top of the atmosphere is
    solar constant * π*R**2      1367.6 W/m**2 * π*R**2   1367.6 W/m**2
   -------------------------  =  ---------------------- = -------------  ≅ 340 W/m**2  ,
          4*π*R**2                     4*π*R**2                 4
4π*R**2 is the surface area of the Earth.About 30 % of this average flux is reflected by ground and Earth's atmosphere. See Earth's energy budget explicated in the figure below (local link / general link: earth_energy_budget_2.html).
So the heating of the Earth's surface AND the Earth's atmosphere is done by ∼ 240 W/m**2 of absorbed flux.
About 170 W/m**2 is absorbed by the Earth surface. This is an average value, of course. There is nothing at night and daytime absorption is very variable and depends on weather, latitude, topography, and other lesser features.
-
The 170 W/m**2 is the value that commercial
solar power
has to rely on.
Solar power is the biggest of all renewable energy sources, and so eventually, I think, it must be the main energy source of the future---but when that future will arrive is very uncertain---20 years, 100 years?
The is no build up of heat energy on Earth: if there was temperature would increase forever.
We'll discuss how Earth's temperature is set below in the section The Greenhouse Effect.
- Other Heat Flows:
What of other heat flows to the Earth surface?
The mean heat flow to the surface from the hot interior of the Earth is only about 0.08 W/m**2 (see Wikipedia: Earth's energy budget).
The tidal heating is 0.0059 W/m**2 (see Wikipedia: Earth's energy budget).
-
Question: What is keeping us warm?
Solar heat
with
a mean flux of
(a)170 W/m**2 to the Earth's surface
and
(b)240 W/m**2 to the Earth's surface
AND
Earth's atmosphere
OR geothermal heat with a mean flux to
the Earth's surface of 0.08 W/m**2?
- The geothermal flux.
- The solar flux.
- Neither.
Answer 2 is right.Clearly, geothermal heating is NOT what keeps us warm.
The geothermal energy going to the continents and continental shelves is primarily due to radioactive materials in the crust itself. The outflow is about 0.057 W/m**2???.
In the oceanic basins, the heat flux is about 0.099 W/m**2 and comes from the deep interior???.
I can't find the reference for these numbers at the moment, but I must have got them from somewhere once upon a time.
- Geothermal Heat Flows:
What is the deep internal source of heat?
Some of it is residual heat energy from formation (∼ 50 %) and some is from radioactive decay past and present of radioactive isotopes (∼ 50 %) (see Wikipedia: Earth's internal heat budget).
The combined internal heat energy drives primordial-radiogenic heat geology (see also Wikipedia: Earth's internal heat budget: Radiogenic heat: Primordial heat).
Further explication is given in the figure below (local link / general link: radiogenic_heat.html).
- Size Matters:
).Why is that past heat energy from formation and past radioactive decay still there inside the Earth?
It just takes a very long time for heat energy to leak out from the interior of a massive object.
Why does size matter? The explication is given in the figure below.
- The residual/radioactive heat energy content of
a spherical body is roughly proportional
to volume or radius to the 3rd power.
- But the rate at which heat flows out of sphere is roughly proportional
to spherical surface area or radius to 2nd power.
- The cooling time scale grows as radius R according to this crude result.
The calculation ignores many complicated effects (e.g., real structure and differences in composition), but it it gives the right scaling of the effect of size on cooling.
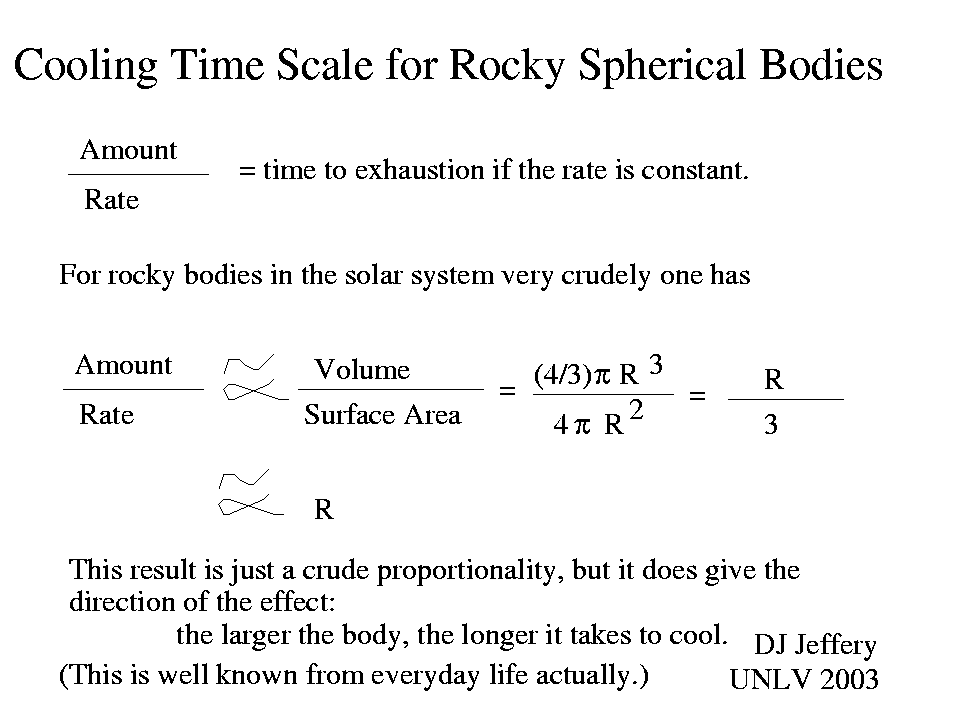
Caption: Cooling time scale for rocky spherical bodies in the solar system.
Features:
The amount of residual/radioactive heat energy that a rocky body has is important for its geological activity since the heat flow of this energy is a major geological driver.
Note, there are two aspects:
- Larger rocky bodies have lost past
residual/radioactive heat energy more slowly.
- They lose current production more slowly.
An asteroid has long-lived
radioactive isotopes
just like a large rocky body.
But the heat energy
just flows out rapidly by heat conduction
and doesn't drive geological activity.
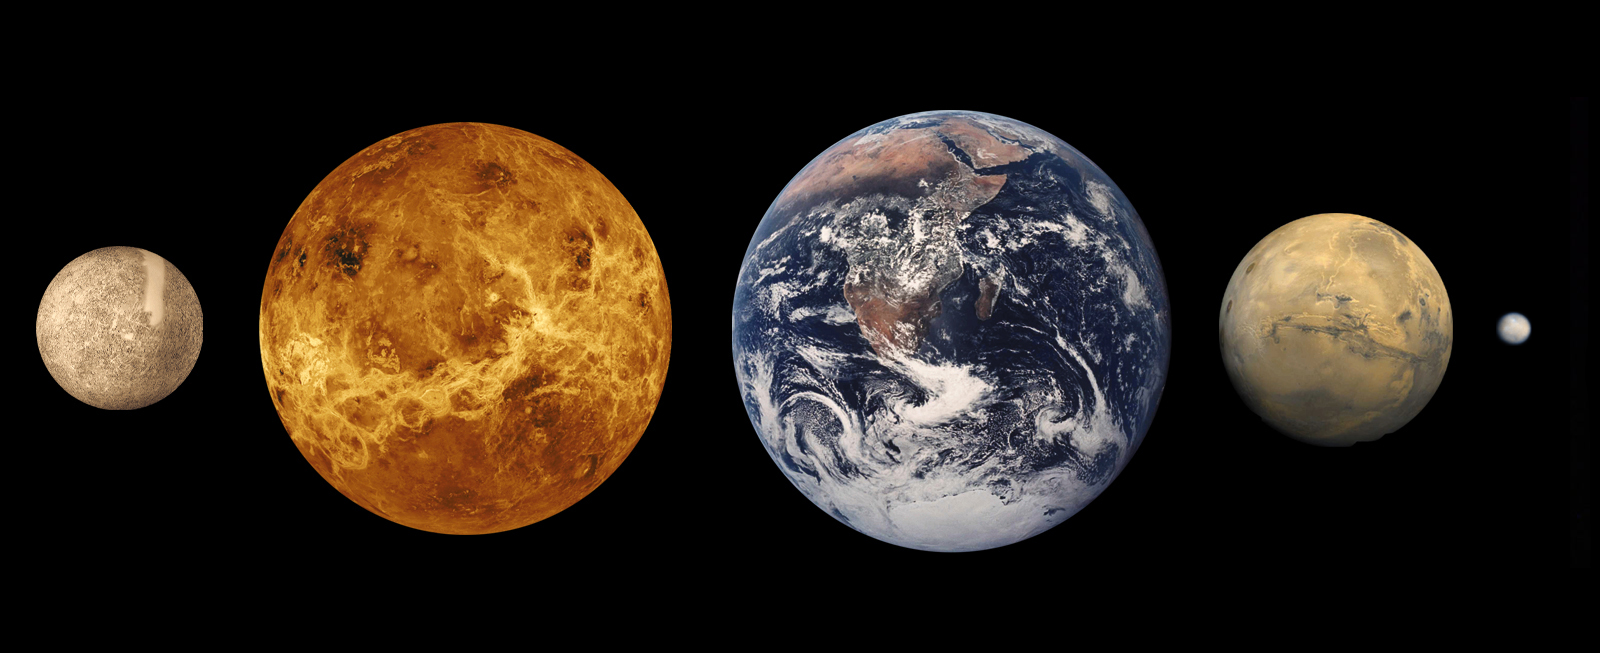
Caption: A relative size comparison of the four rocky planets Mercury, Venus, Earth, and Mars and the rocky dwarf planet Ceres (which is also the largest asteroid).
The Venus image is false color and shows topography with the veil of Venusian atmosphere stripped away.
Unfortunately, the image of Venus of what the colors mean except that they show structure. The bright elongated horizontal region at the center is Aphrodite Terra which is one of the three Venusian terrae which are continent-like highlands.
The Mercury image is rather old since it cowlick of unimaged surface which has since been imaged by the NASA MESSENGER probe (MESSENGER Team Releases First Global Map of Mercury, 2009dec15
The Moon should be shown too since it also counts as a large rocky body. Its radius is 0.271 Earth radii which is NOT so much smaller than Mercury's radius of 0.3829 Earth radii.
Credit/Permission: NASA, 2009 (uploaded to Wikipedia by User:Weirdoinventor, 2009) / Public domain.
Image link: Wikipedia: File:5 Terrestrial planets size comparison.png.
Below we explicate primordial-radiogenic heat geology of some Solar System objects:
- Earth is the largest rocky body and has the most active
primordial-radiogenic heat geology:
i.e., volcanoes,
plate tectonics, and earthquakes.
- Venus's radius
is about 0.8 of the Earth's, and thus has a
somewhat shorter time scale for cooling.
And apparently, its primordial-radiogenic heat geology is somewhat less than that of Earth. It's surface is renewed more often than once per gigayear, but this is about 5 times slower than the renewal time for most of the Earth's surface (CW-34).
- Mars's radius is 0.5326 of the Earth's
(Cox-295), and thus has
significantly shorter time scale for cooling.
Mars probably had primordial-radiogenic heat geology comparable to Earth's once. Now it is much slower, but probably NOT dead as older textbooks used to say.
Volcanic activity probably still occurs at a slow rate (HI-189; Baker, V. R. 2005, Nature, 434, 280).
- The Moon
and Mercury have radii of about
that are about 1/4 of and 2/5 of Earth's, respectively.
They seem to have been dead in regard to
primordial-radiogenic heat geology
for billions of years.
They still have radioactive isotopes releasing heat energy, but it heat conduction to the surface releases it to the surface so quickly that it CANNOT drive primordial-radiogenic heat geology.
- Some of the large asteroids it seems did have
primordial-radiogenic heat geology
at one time (Se-565).
But they are all smaller than the Moon and long ago lost nearly all their residual heat energy.
Like the Moon and Mercury, they still have radioactive isotopes releasing heat energy, but it heat conduction to the surface releases it to the surface so quickly that it CANNOT drive primordial-radiogenic heat geology.
As mentioned above, aluminum-26 (half-life 0.717 Myr) may have driven the primordial-radiogenic heat geology even on rapidly cooling small rocky bodies like asteroids.
The asteroids are now nearly geologically dead, except for impact geology, space weathering, and diurnal temperature cycle weathering. All very slow processes.
- Size Matters for the Earth:
Earth's large size has maintained its primordial-radiogenic heat geology.
This is important for life on Earth. As dangerous as volcanoes and earthquakes are, we need primordial-radiogenic heat geology.
If primordial-radiogenic heat geology turned off, Earth's continents would erode and wash away leaving us with an ocean planet or WATER WORLD, but without Kevin Costner (1955--).
Also volcanic outgassing sustains the carbon dioxide (CO_2) over geological time scales. Without CO_2 gas in the atmosphere, life as we know it would cease.
-
Actually, volcanic outgassing
is probably probably slowly losing ground to
calcium carbonate formation which
removes carbon dioxide (CO_2) over geological
time scales (see section Sedimentary Rock Formation below).
This may spell the doom for
life as we know it on Earth
on the time scale of a gigayear
(see Rampino, M. R. & Caldiera, K. 1994,
ARAA, 32, 83-114, The Goldilocks Problem: Climatic Evolution and Long-Term Habitability of Terrestrial Planets).
Then we'd have an ocean planet, unless the water all disappeared first.

-
Plate tectonics
is relatively new theory.
- Heat Flow:
To start with heat energy flows from hot to cold spontaneously which is a manifestation of the 2nd law of thermodynamics.
The temperature of the interior of the Earth rises going inward up to maybe 5000 K in the center.
Thus, heat flows outward in the Earth.
Some of the flow is by heat conduction: one atom's thermal kinetic energy being directly transferred to another or by FREE MOVING ELECTRONS in conductors.
-
Metals (in the ordinary sense of the word, NOT the astrophysical sense)
are good heat conductors for the same reason they are good
electrical conductors: they have free moving electrons. The electrons
transport charge necessarily, but they also transport kinetic energy:
i.e., heat energy.
This is why metal spoons are NOT good for stirring boiling water.
-
Question: Can convection can happen inside the Earth?
- Yes, because some of the interior is liquid and some of it is rather plastic.
- No, because some of the interior is liquid.
- Yes, because the interior is entirely rigid solid.
Answer 1 is right.Material that is plastic can convect though very slowly compared to liquids. A plastic in this sense is a material that deforms permanently under an applied force (Wikipedia: Plasticity).
Actually, the combination of the Earth's rotation and the convection in the liquid iron outer core causes electric currents that drive a dynamo effect that creates the Earth's magnetic field. We discussed this briefly in IAL 8: The Sun. Somehow macroscopic kinetic energy gets turned into charge separation energy and then electrical currents flow which in turn generate magnetic fields.
As a recapitulation on convection, see the figure below (local link / general link: convection.html).
- Convection in the Asthenosphere:
In the asthenosphere (i.e., the lower mantle), it is also believed that the plastic mantle convects and the convection cycle drives plate tectonics.
It is thought there are huge if slowly cycling convection cells in mantle convection---the time scale of a complete cycle thought to be ∼ 200 Myr (see Wikipedia: Mantle convection: Speed of convection).
See the cartoon of mantle convection and mantle convection videos in the figure below (local link / general link: usgs_004_convection.html) and the computer simulation of mantle convection in the second figure below (local link / general link: mantle_convection_model.html).
- Tectonic Plates and Plate Boundaries:
The surface manifestation of the asthenosphere convection cells are the tectonic plates which consist of two main regions: oceanic basins and relatively high continents.
The surface manifestations of the boundaries between asthenosphere convection cells are the tectonic plate boundaries There are three kinds as illustrated in the figure below (local link / general link: usgs_002_plate_boundaries.html).
- Divergent boundaries
where new crustal material is being formed.
Very hot lava flows up from the deep asthenosphere and fairly quiescently (SWT-571) creates new crust in a relatively narrow valley called a rift.
But volcanoes are possible too as in Iceland (which straddles a divergent boundary) demonstrates.
The rifts are typically bounded by twin ridges.
Most divergent boundaries are under the oceans and are marked by giant mountain chain systems split by central rifts. These systems are called mid-ocean ridges.
-
The ocean crustal material is dominated by basalt rocks.
These are relatively metal-rich (i.e., Mg, Al, Ca, Fe rich)
silicates that formed by fast cooling from
lava or magma
(CW-39, 195;
SWT-569).
Basalts to have small crystals and be dark (SWT-568).
As the material moves away from the mid-ocean rift (being dragged by the motion of the underlying asthenosphere convection cell), it cools and grows more dense and at a convergent boundaries (i.e., subduction zones) it can slides under another plate.
- Convergent boundaries (or subduction zones)
are where crust disappears in a process
called .
One of the tectonic plates slides beneath the other.
At oceanic convergent boundaries there is usually a deep oceanic trench.
A famous example of a convergent boundaries is the Mariana Trench in the western Pacific Ocean dropping to 10.984 km below mean sea level: the deepest place on Earth (Wikipedia: Mariana Trench). See the diagram of the Mariana Trench in the figure below (local link / general link: mariana_trench.html).
Between continental tectonic plates there are no trenches (SWT-594).
On subduction some subducting matter heats up from contact with the asthenosphere and then becomes low density molten rock that rises and emerges as lava that forms volcanoes SWT-594).
-
The emergence is often eruptive.
Volcanic mountain chains often form where a oceanic plate subducts below an oceanic or continental plate: e.g., the Andes of South America and the Cascades of Washington State (SWT-594).

Caption: Zagros Mountains from space.
They straddle the Iran-Iraq border.
They are a fold mountain systems.
There is no perfect folding, of course. But you can mountains are stretched in one direction. Those mountains are the upfolds.
Credit/Permission: NASA, 1992 (uploaded to Wikipedia by User:Amizzoni~commonswiki, 2006) / Public domain.
Image link: Wikipedia: File:Zagros 1992.jpg.
-
Fold mountain systems
can probably happen at other places than plate
boundaries. The Alps seem a bit remote from the boundary between
the African and Eurasian tectonic plates.
There are also FAULT-BLOCK MOUNTAINS that occur when the crust is fractured and one side is uplifted. The Sierra Nevada Mountains in California are FAULT-BLOCK MOUNTAINS (SWT-607).
-
The continental and continental shelf crustal material is dominated by
GRANITES.
These are relatively less metal-rich silicates than
basalts
and hence have more Si and O in their composition
(CW-39).
Granites tend to have large crystals from slow cooling of lava or magma (CW-195). They tend to be lighter in color ???? than basalts and less dense.
The continental material rose up above the oceanic crust because of its lower density---which is NOT full explanation of why continents form. (We discuss continents a little bit further below in the section The Past and Future of Plate Tectonics.)
Note, both continental and oceanic crusts are immensely complex with all kinds of variations: the distinction into basaltic and granitic just gives the main trend.
- Transform boundaries
are where tectonic plates just slide against
each other.
For example, the North American Plate and the Pacific Plate have a transform boundary in California: the San Andreas Fault. Earthquakes near transform boundaries are common (SWT-595).
In simple terms, the tectonic plates try to slide past each other, but are caught on each other by friction and other forces??? and elastic potential energy builds up until there is a sudden release of stored potential energy as kinetic energy.
Everything moves and shakes and then the transform boundary comes into a new relatively stable configuration---for awhile.
The tectonic plate boundaries, particularly on dry land, are NOT always obvious since surface material can camouflage them.
Of course, before modern geology, they were NOT recognized at all as tectonic plate boundaries.
The tectonic plate boundaries do move around over geollgical time scale: hence continental drift. Tectonic plates grow, shrink, and move.
- Where Are the Tectonic Plates and the Plate Boundaries?
The tectonic plates and tectonic plate boundaries have been mapped probably pretty completely and accurately.
There are 7 or 8 (depending on how you count them) major plates and 15 minor plates (i.e., tectonic plates of area less than 20 million km**2, but more 1 million km**2).
-
Note, the
surface area
of the Earth
is 510.072 million
square kilometers.
So the 1 million km**2 is a good
natural unit
for area on Earth.
It is one EU.
See
Earth unit (EU)
But there are a few number that cross land for part of their length.
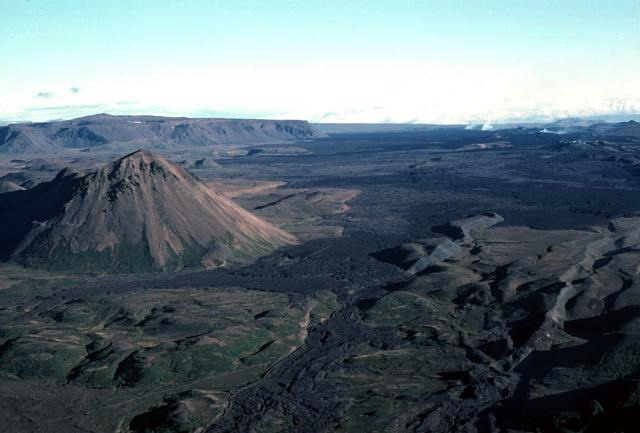
For example, the Mid-Atlantic Ridge (a divergent boundary) crosses Iceland. See the figure below.
 Caption: Iceland straddling
tectonic plate boundary,
a divergent boundary
the Mid-Atlantic Ridge.
Caption: Iceland straddling
tectonic plate boundary,
a divergent boundary
the Mid-Atlantic Ridge.
In fact, the Mid-Atlantic Ridge crosses the Reykjanes Peninsula where Reykjavik is.
Circa 2023 on, the Sundhnukur eruptions (2023--) are disrupting life on the Reykjanes Peninsula---but if you choose to live on a divergent boundary ...
Credit/Permission: U.S. Geological Survey (USGS), before or circa 2005 / Public domain.
Download site: USGS: Understanding plate motions.
Image link: Itself.
The figure below (local link / general link: iceland_satellite_image.html) shows a satellite image of Iceland. There is NO obvious tectonic plate boundary visible even though the Mid-Atlantic Ridge goes right over Iceland.

Caption: "Rock outcrop in Iceland, a visible surface feature of the Mid-Atlantic Ridge, the easternmost edge of the North American plate. A popular destination for tourists in Iceland."
You wouldn't know this is part of a tectonic plate boundary without other geological evidence. It could be any old rock outcrop.
Credit/Permission: User:Pmarshal, 2006 / Public domain.
Image link: Wikipedia: File:Iceland mid atlantic ridge.JPG.
There are frequent volcanic eruptions in Iceland along the Mid-Atlantic Ridge. See the two figures below.
Caption: Krafla volcano in 1984.
Krafla is on the Mid-Atlantic Ridge as it crosses Iceland.
Credit/Permission: Michael Ryan, U.S. Geological Survey (USGS), 1984 (uploaded to Wikipedia by User:Peko, 2006) / Public domain.
Image link: Wikipedia: File:Krafla usgs.jpg.
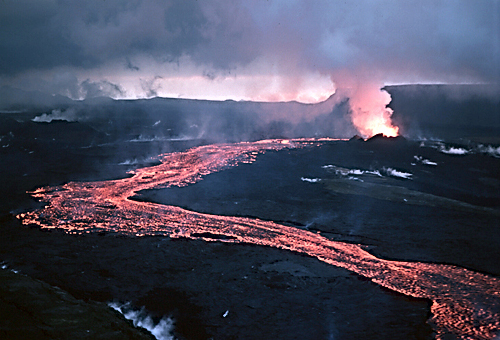
Caption: "Lava flow during a rift eruption at Krafla volcano, northern Iceland, 1984."
Krafla is on the Mid-Atlantic Ridge as it crosses Iceland.
See also the eruption image at USGS Krafl site.
Credit/Permission: Michael Ryan, U.S. Geological Survey (USGS) 1984 (uploaded to Wikipedia by User:Galar71, 2007) / Public domain.
Image link: Wikipedia: File:Lava flow at Krafla, 1984.jpg.
See Volcano videos below (local link / general link: volcano_videos.html):
- EOF
But from the air, its linear form can be picked out. See the two figures below.
Caption: San Andreas Fault.
This is an aerial view of the San Andreas Fault splitting Carrizo Plain in the Temblor Range east of San Luis Obispo, California.
The San Andreas Fault is one of the relatively few places where a tectonic plate boundary crosses land. Lower California is will one day become an island.
For more information on the San Andreas Fault, see USGS The San Andreas Fault site
Credit/Permission: USGS. circa or before 2005 / Public domain.
Download site: USGS: photographer Robert E. Wallace, USGS.
Image link: Itself.
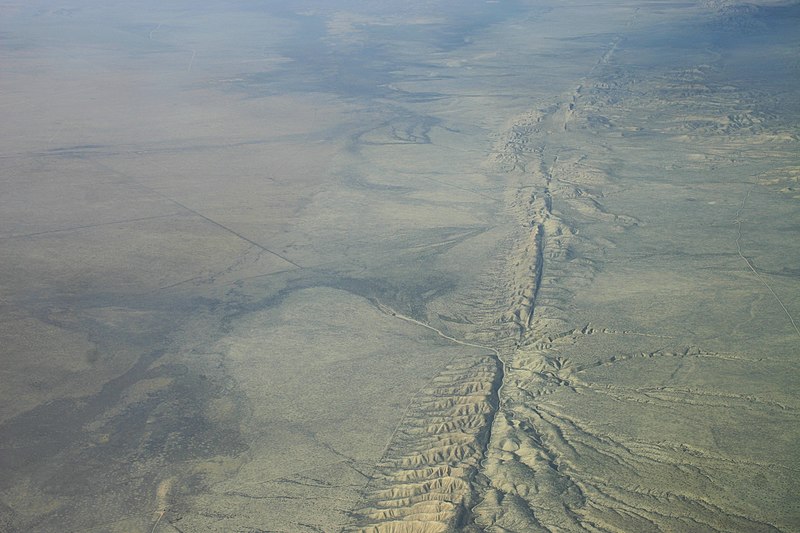
Caption: "San Andreas Fault in the Carrizo Plain, aerial view from 8500 feet altitude'' (November 2007nov16).
Double-click to see the high-resolution version.
From the air, the San Andreas Fault is a striking geological feature---a sort of long double ridge with a narrow valley between the ridges.
But on the ground, it may just be landscape as far as the geologically challenged can see.
The tectonic plates are jammed together and erosion has probably mostly covered the surface fault---but miles down it reaches.
Credit/Permission: © Ian Kluft AKA User:Ikluft, 2007 / Creative Commons CC BY-SA 3.0.
Image link: Wikipedia: File:Kluft-photo-Carrizo-Plain-Nov-2007-Img 0327.jpg.
The idea of continenal drift (a key component of plate tectonics) was introduced in the early 20th century by Alfred Wegener (1880--1930) and only slowly gained traction.
The full theory of plate tectonics only emerged in the 1960s through the work of many including Canadian John Tuzo Wilson (1908--1993).
-
Yours truly remembers the hoopla---"The Continents are Adrift" in
Reader's Diget
sometime in the later 1960s, etc.
In one sense, it is surprising that it was so late since it is the biggest of Earth's geological processes.
But the fact is that the motions of plate tectonics are excruciatingly slow on the human lifetime time scale---as most geological processes are---and the tectonic plates themselves are pretty thoroughly camouflaged.
So plate tectonics is NOT at all obvious.
Nowadays plate tectonics is a very robust theory. It's truth.
Of course, endless refinements continue to appear---and many of those have uncertain status: very strongly supported, possible, probably wrong, etc.
Here we can only give a simplified outline of plate tectonics.


Group Activity:
Form groups of 2 or 3---NOT more---and tackle Homework 11 problems 11--17 on plate tectonics.
Discuss each problem and come to a group answer.
Oh, 5--10 minutes.
See Solutions 11.
The winners get chocolates.
-
So we have heard of plate tectonics---what of the
past and future?
- General Remarks:
We can make some general remarks to start with.
The oldest oceanic crust is of order 200 Myr (see Wikipedia: Oceanic crust: Life cycle). Recall, the oceanic crust is directly formed and destroyed by mantle convection whose convection cycle is of order 200 Myr (see Wikipedia: Mantle convection: Planform and vigour of convection).
On the other hand, continental crust is NOT directly formed by mantle convection (see section Continent Creation below) and has a range of ages: estimates are 20 % before 3 Gyr Before Present (BP), 60 % between 3 and 2.5 Gyr BP, and 20 % between 2.5 BP and today (see Wikipedia: Continental crust: Origin).
Note, the oldest Earth rock known is zircon crystals from Western Australia that is dated to 4.4 Gyr (Wikipedia: Oldest dated rocks: Oldest terrestrial material).
- Continent Creation:
We know that ocean basin crust is created at divergent boundaries.
How is the continental crust created?
The continents were created by two uplifting processes: accretionary wedges and volcanism:
- Accretionary wedges:
At a subduction, sedimentary rock
(which we discuss below) is scraped off the subducting
tectonic plate and builds up as an
accretionary wedges
(The Mountains of Wisconsin site).
- Volcanism: The
volcanoes that form near a subduction
zone come from molten subducted rock.
This rock that is more rich
in silicon-oxygen,
melts more easily and is less dense
than basalt rock.
that forms most of the ocean basin crust.
It tends to be granitic rock.

Caption: An accretionary wedge at a subduction zone.
Continents are built up by accretionary wedges and volcanism.
Credit/Permission: United States Geological Survey (USGS), USGS Earthquake glossary, before or circa 2009 (uploaded to Wikipedia by User:Miya, 2009) / Public domain.
Image link: Wikipedia: File:USGS Visual Glossary-Accretionary wedge.gif.
Both sedimentary rock from accretionary wedges (granitic rock) and rock from volcanoes that go into making the continents are less dense than oceanic sedimentary rock and deeper rock???.
Thus, at convergent boundaries, where continental and oceanic tectonic plates meet the continents tend to be the winners---they tend to stay on top???.
So continents tend NOT be subducted and recycled in the giant mills of mantle convection.
The subduction rate of the continents is thus much slower than that of the ocean basin crust.
This is why continents are generally older than ocean basin crust and why parts of continents can be very old.
Of course, continents do erode as well as get built and so their surfaces CANNOT last forever. Their bits get washed in the ocean basins.
But it does seem that the total land area of the continents has NOT changed radically in the last 225 Myr or so despite the continents being shifted around a lot (see below).
So continent creation by accretionary wedges and volcanism and destruction by erosion (and maybe sometimes when continental tectonic plates meet at convergent boundaries by subduction) must be roughly in balance????. But the creation and destruction rates are both slower than for ocean basin crust, and so the continents on average are much older than the ocean basin crust.
- The Origin of Plate Tectonics:
UNDER CONSTRUCTION see the figure below (local link / general link: .html)
- The Past:
The early past of the tectonic plates gigayears ago is hard to trace.
Their motion, often called for historical reasons continenal drift, is uncertain.
It is NOT really possible I think to trace where the continents were to such early times as 3 Gyr ago. But some parts of the modern continents were around then.
The constant crustal creation and subduction has moved the continents around too much to trace their locations back to 3 Gyr.
It has been possible to trace the continents back to 220 Myr ago (i.e., 220 million years ago) using radioactive dating and magnetic dating with some certainty (CW-41).
Movements back to 600 Myr ago are known roughly (WB-91).
-
Note, the first dinosaurs appeared about 250 Myr ago
and they extincted about 65 Myr ago
(Cox-250).
See figure below.

Caption: A replica of the fossil of the dromaeosauridae Sinornithosaurus (specimen NGMC 91, nicknamed Dave) at the American Museum of Natural History in New York City. Specimen NGMC 91 is about 75 cm long.
Sinornithosaurus was a small feathered dinosaur.
Some Sinornithosaurus types may have been able to glide (see Wikipedia: Sinornithosaurus: Feathers).
Sinornithosaurus is NOT in the lineage of birds---the dinosaurs of our day.
Credit/Permission: © User:Dinoguy2, before or circa 2006 / CC BY-SA 1.0.
Image link: Wikimedia Commons: File:Sinornithosaurus Dave NGMC91.jpg.
For example, the Atlantic Ocean is widening at about 3 cm/yr (Ze2002-158).
-
Question: What also grows at about 3 cm/yr?
- Human hair.
- Human fingernails.
- Dandelions.
Answer 2 is right.Pointing out this factoid seems to be de rigueur when discussing plate tectonics: the textbooks all seem to mention it (PF-95).
- The Future:
What is in store for the future?
Plate tectonic modeling suggests that most of the continents will ram together again to create a new supercontinent in about 250 Myr (WB-92).
- Why are They Where They Are?
Is there any fundamental reason for the arrangements of continents and tectonic plates as we see them?
Probably NOT.
Initial conditions on the early Earth were probably set randomly and then evolved in a deterministic fashion, but over the gigayears the motion may be so super-sensitive to initial conditions that it may NOT be predictable in practice from the initial conditions.
- Continent Creation:


Group Activity:
Form groups of 2 or 3---NOT more---and tackle Homework 11 problems 11--17 on plate tectonics.
Discuss each problem and come to a group answer.
Oh, 5--10 minutes.
See Solutions 11.
The winners get chocolates.
-
Plate tectonics is the biggest of
all geological processes:
- It resurfaces the ocean floors.
- It builds continents through accretionary wedges and volcanism.
- It builds mountains through volcanism and folding and faulting processes.
There are many other geological processes---and a lengthy discussion is beyond our scope---but we should mention a few main ones in brief.
Weathering of rock, erosion, and sedimentary rock formation which I collectively call EROSION GEOLOGY.
There is also hotspot volcanism (which is a feature of primordial-radiogenic heat geology and impact geology (i.e., the cratering by impactors from space).
There are other geological processes that do not much affect Earth: tidal heating geology (which is very important Jupiter's moon Io) and space weathering (which probably only affects airless worlds).
-
On Earth, the main culprit is
water: liquid or solid.
Liquid water can dissolve rock or provide a solution of other chemicals that dissolve rock.
Solid water (ice) can cause FROST WEDGING: water freezing in crevices expands and fractures.
Glaciers as they move can also break up rock. See figure below (local link / general link: glacier_johns_hopkins.html).
Wind is a much weaker than
water
in weathering in general, but
it is important particularly in arid areas like the American Southwest where
water weathering is comparatively week.
Wind weathering is very important on
Venus
and Mars
where there is no liquid water.
Martian glaciers exist
and must cause some weathering.
They are covered by
Martian soil, and so
NOT obvious in images.
Wind, especially when carrying dust or sand particles, can abrade rock surface.
Mars may have a
liquid water subsurface at least some of the time.
Intermittently and briefly, there may even be surface liquid water
today---but NOT likely.
See IAL 14: Mars: the Red Planet.
Such liquid water can cause
some weathering.
-
Apparently, geologists like to think of erosion as
weathering PLUS
downward transport (leveling) by liquid water,
glaciers, and
wind.
- Nothing much would change anytime soon, but eventually volcanism, uplift, and most earthquakes would stop.
- The continents would NOT be renewed and over hundreds of millions of years would wear away.
Liquid water can easily move dissolved material and fine particles. Larger particles or pebbles can be rolled along. Floods can move large objects up to the size of boulders.
Glaciers can move small and large rock fragments and boulders too.
Wind is much less powerful, but it can blow dust and sand around. In arid regions this is an important process.
Water usually and wind probably on average move rock material downhill depositing it lower regions and ultimately on the oceanic seafloor.
-
Question: What if
primordial-radiogenic heat geology
turned off.
Both answers seem right to me.
The Earth would become an ocean planet eventually---if the water lasted so long.
The Mississippi Delta was created by erosion followed by geological deposition.
See the Mississippi Delta in the figure below (local link / general link: mississippi_delta.html).
-
Sedimentary rock
is one three main classes of
rock which are:
- Igneous rock forms from
lava or
magma (which is underground
lava).
- Metamorphic rock is
formed from pressure and/or heating
of igneous rock
or sedimentary rock. But
NOT heating to the point of melting.
- Sedimentary rock
is a type of rock formed by the accumulation
and/or deposition of mineral and/or organic particles on the Earth's surface
(usually below water bodies) which
then under go cementation.
- depositions of sediments of rock in water.
- depositions of sentiments of rock in water.
- secondary volcanic activity.
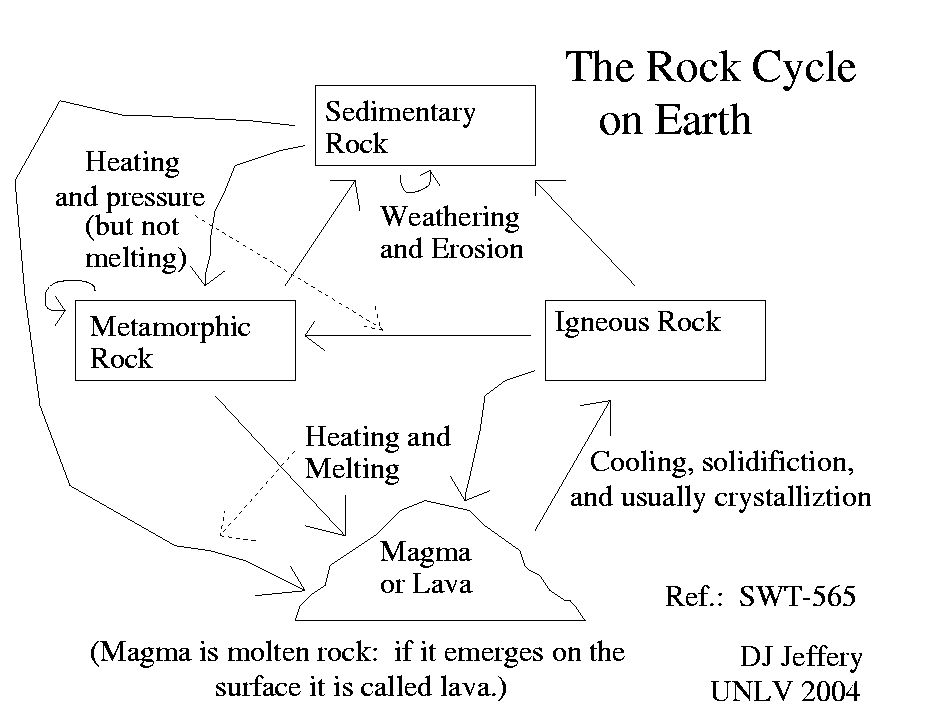
Caption: The rock cycle of the Earth.
Credit/Permission: ©
David Jeffery,
2004 / Own work.
Image link: Itself.
But most sedimentary rock is mostly silicates (CW-199).
-
Question: Sedimentary rock forms from:
Answer 1 is right.
Common cementing agents are silica (SiO2), iron oxides, and calcium carbonate (CaCO_3) (SWT-577).
Calcium carbonate is particularly important.
-
CO_2 which dissolves in
water reacts with
liquid water
to give carbonic acid (H_2CO_3)
which in turn reacts with calcium-containing
minerals to give calcium carbonate
(CW-193:
RC-88).
This is a major process by which CO_2 is removed quasi-permanently from the atmosphere.
Only quasi-permanently since volcanic action can free CO_2 again by volcanic outgassing during lava flows.
Note, the process requires liquid water.
But it's much more important than 8 % suggets.
Sedimentary rock is the covering layer of ∼ 73 % of the continents (see Wikipedia: Sedimentary rock) and apparently even more of the ocean basins (SWT-576).
Most of North America is covered by a veneer of sedimentary rock a few kilometers thick. In many parts of the continental interior sedimentary rock is almost all you see.
-
Not that yours truly can tell one
rock from another.
This is a pretty common sight in the American west. A famous example is the Grand Canyon (Se-437). See the figure below.
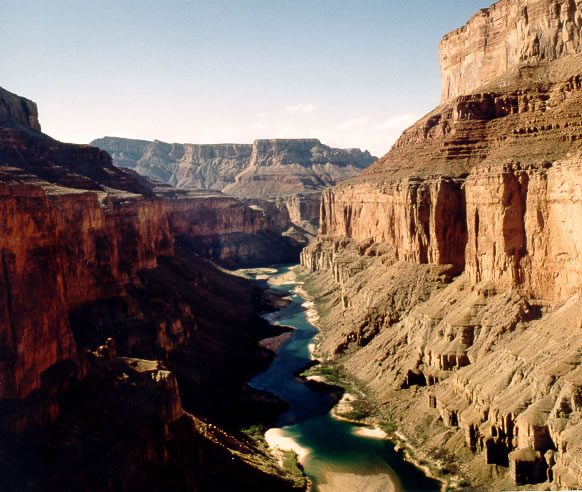
Caption: A view of the Grand Canyon presumably.
There was no caption at the USGS Grand Canyon site.
Credit/Permission:
U.S. Geological Survey (USGS),
before or circa 2004 /
Public domain.
Image link: Itself.
Studying the layers of rock (i.e., the strata), particularly sedimentary rock, is stratigraphy.
Studying the strata is a main way to learn about geological and biological history.
-
Whenever yours truly flys over
Los Angeles, California,
yours truly always say to yours truly's self
geological strata in the making.
-
Volcanoes mainly form near
tectonic plate boundaries
where there is
direct upflow in rifts or upflow from heating as
most rock descends
to the hot asthenosphere
in subduction zones
(i.e., convergent boundaries).
- A mantle plume
from the
outer core-mantle
boundary rises (probably in a somewhat complicated fashion)
through the
asthenosphere
(lower mantle in red),
lithosphere
(upper mantle in yellow)
and the crust
(dark yellow).
- The asthenosphere
and mantle plume are both
red in the diagram.
It may be that there is a broad pool of hot rock in the
asthenosphere
brought there by a
superplume
from the
outer core-mantle
boundary.
- The surface and near surface manifestation of the
mantle plume is a
hotspot.
- The lava from the
mantle plume
builds volcanoes.
- As the crust slides over
the hotspot due
to plate tectonic motion,
a series of
volcanoes can be created.
- The volcanoes become
extinct after moving off the
hotspot
and erode away.
- If the hotspot
is in the ocean, the eroding
volcanoes will eventually
submerge and become
volcanic seamounts.
Seamounts are
submerged oceanic mountains,
most of which are volcanic seamounts.
But there are places where the tectonic plates ride over point-like hotspots in the asthenosphere.
At a hotspot, a volcano can arise that is then shifted away from the hotspot by tectonic plate motion and becomes extinct.
The theorized origin of the hotspots are mantle plumes of hot rock that arise from the boundary of the outer core and the mantle.
-
The theory of mantle plumes
has been controversial because, among other things,
mantle plumes are hard to
directly detect.
However, since circa 2013, mantle plumes seem to be becoming a consensus theory:
But "the plume deniers are fading," says retired geochemist Stanley Hart (c. 1935--). "The major forces are getting older, and none of the young guys are picking it up." Plume critics aren't writing peer-reviewed papers, he says, so "I don't argue with them anymore; it's a distraction." (Slightly edited.)
-
Science advances one
funeral at time.
-
---Max Planck (1858--1947)
(see Wikiquote: Max Planck).
-
A seamount is any
oceanic mountain
that doesn't breach the surface.
Most seamounts are volcanic seamounts.

Caption: A diagram illustrating hotspot geology driven by mantle plumes.
Features:
Image link: Wikipedia: File:Hotspot(geology)-1.svg.
There are lots of hotspots and therefore mantle plumes. See the figure below.

Caption: Mantle plume locations suggested by Gillian R. Foulger, 2010, Plates vs Plumes: A Geological Controversy.
Credit/Permission:
Gillian R. Foulger,
2011 /
Public domain.
Image link: Wikimedia Commons:
File:CourtHotspots.png.
The most famous hotspot is the one that has created the Hawaiian Islands and Emperor Seamount Chain (SWT-571).
The figure below (local link / general link: hawaii_hotspot.html) shows images of the Hawaiian Islands and the Hawaii hotspot.
Another well known hotspot is the Yellowstone hotspot which creates a geologically active area in the vicinity of Yellowstone National Park under which the Yellowstone hotspot is centered---you know, Old Faithful, etc.
-
Impact geology
is caused by impactors, large and
small, from
space
and is evidenced by impact craters and
regolith
(which
is the broken up and shocked materials from micro-meteoritic
impacts).
- Small impactors
tend to vaporize due to
atmospheric ram pressure
in the atmosphere, and so
small craters and regolith (fragments of
rock broken up
by micrometeoritic impactors)
tend NOT to form on Earth.
You can have some,
of course, but they don't last long because of
erosion.
- All impactors, large and small,
suffer erosion and
crustal renewal by plate tectonics, and
thus tend to vanish quickly (on geological time scales) eliminate craters, particularly the smaller ones.
Now there are two kinds of geologic craters that are quite different and have to be distinguished: volcanic craters and impact craters. Volcanic craters are on top of volcanoes and result from primordial-radiogenic heat geology. Impact craters arise from space debris (meteoroids, asteroids, and comets) falling on Earth.
We will discuss impactor physics and the distinction between impact and volcano craters in IAL 12: The Moon and Mercury and the current impactor danger to the Earth in IAL 16: Asteroids, Meteoroids, and Target Earth.
Most rocky/icy bodies in the solar system are heavily impact cratered, but Earth is NOT even though it has been impacted at a similar rate.
The absence of obvious impact craters is because of two reasons.
Thus, impact geology has been comparatively unimportant Earth since the heavy bombardment: during the heavy bombardment, impact geology was important on Earth.
There are 190 confirmed Earth impact craters as of circa 2024 and other probable or possible ones (see Earth Impact Database).
But most of these craters are NOT obvious the way craters on the Moon are.
Erosion has degraded their appearance in many cases and in many cases they are pretty much buried by sediment.
There is a fairly obvious impact crater in Quebec. See the figure below. (local link / general link: crater_manicouagan.html).
There is hidden, but important,
impact crater off the
Yucatan Penisula.
For elucidateion, see the maps in two figures below
(local link /
general link: map_mexico_cia.html;
unlinked).
Caption: "This shaded relief image of Mexico's Yucatan Peninsula show a subtle, but unmistakable,
indication of the Chicxulub impact crater.
Most scientists now agree that this impact was the cause of the
Cretaceous-Tertiary (K-T) extinction event,
the event 65 million years ago that marked the sudden extinction of the
dinosaurs as well
as the majority of life then on Earth."
You'd never know the Chicxulub crater was there
without some authority to tell you.
Credit/Permission: NASA,
2000
(uploaded to Wikipedia by
User:David Fuchs
2010) /
Public domain.
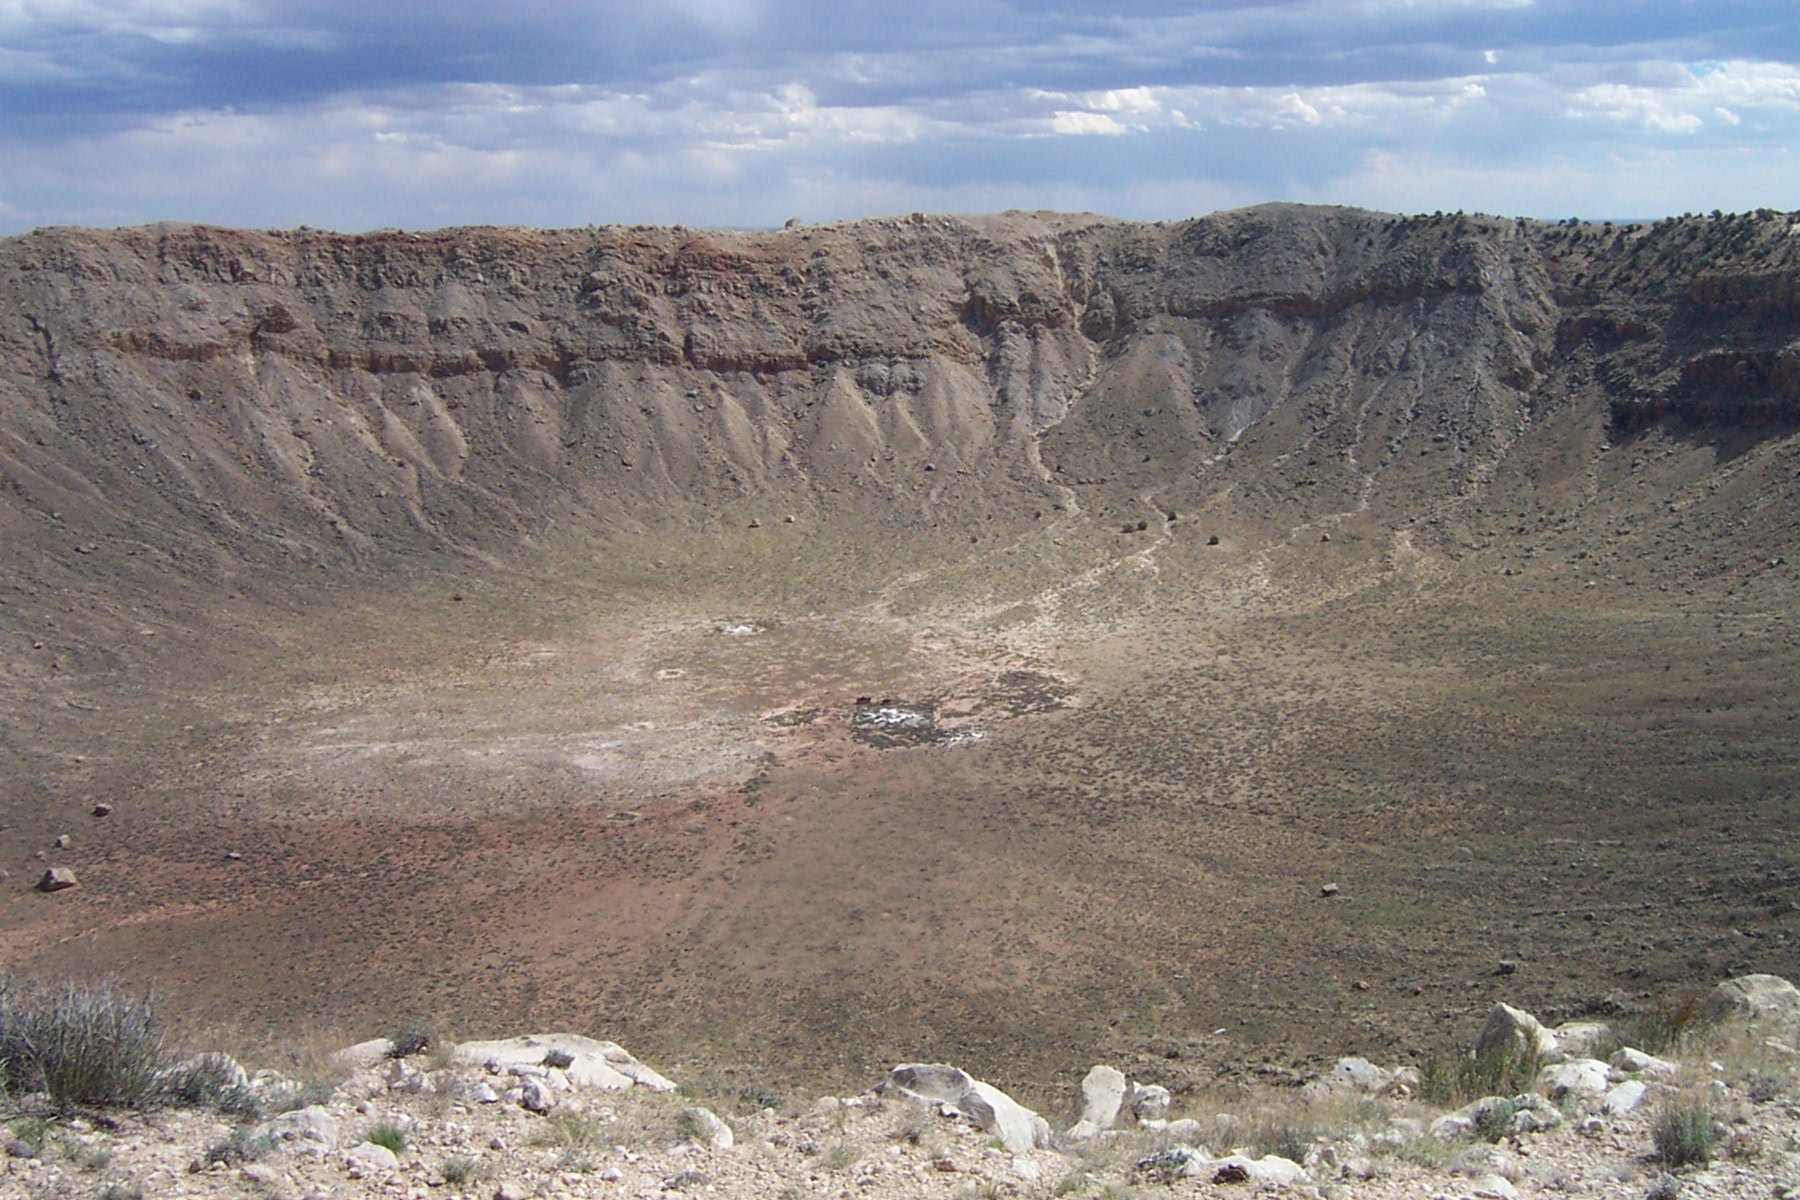
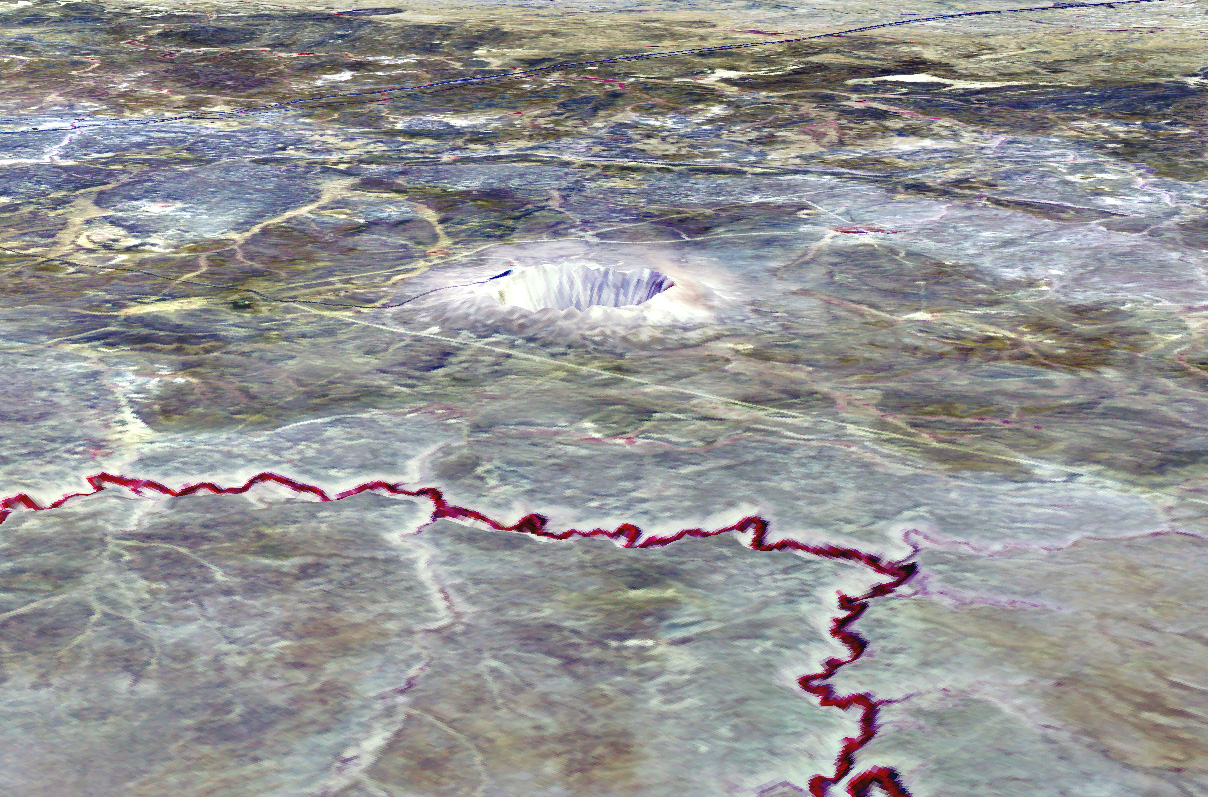
There are a few impact craters that look like impact craters.
The most famous is Meteor Crater (AKA
Barringer Crater) near
Winslow, Arizona.
See the two figures below.
Meteor Crater is about 50,000 years old,
has a diameter of about 1.2 km, and is about 180 meters deep.
The Meteor Crater impactor
was an iron-rich
meteoroid of about 50 m in diameter.
The impact energy was equivalent to about that
of 20-megaton H-bomb (FK-362).
The Meteor Crater impactor
itself was fragmented and spread about in the crater or
ejected out. There is no single big meteorite to be found it seems.
Credit/Permission:
US Geological Survey (USGS),
before or circa 2005 /
Public domain.
Caption: Meteor Crater in
Arizona.
More on Earth craters can be found
at the Geological Survey of Canada's
Earth Impact Database.
Credit//Permission: NASA,
before or circa 2005 /
Public domain.
As aforesaid, small impact craters get erased pretty quickly.
They can be just muddy holes in the ground like the
Carancas impact event crater.
The Carancas impactor
hit near Carancas, Peru,
2007
Sep15.
For images of the Carancas impact event crater,
google Carancas crater.
See
Asteroid videos impactors
below
(local link /
general link: asteroid_impact_videos.html):
Form groups of 2 or 3---NOT more---and tackle
Homework 11
problems 15--19 on
plate tectonics and
volcanism
Discuss each problem and come to a group answer.
Oh, 5--10 minutes.
See Solutions 11.
The winners get chocolates.

Image link: Wikipedia:
File:Yucatan chix crater.jpg.
 Caption:
Meteor Crater (AKA
Barringer Crater) east of
Winslow, Arizona, just
off I-40, Arizona.
Caption:
Meteor Crater (AKA
Barringer Crater) east of
Winslow, Arizona, just
off I-40, Arizona.
Download site:
USGS:
MeteorCrater.
Image link: Itself.
Download site: NASA: Visible Earth.
Alas, a dead link.
Image link: Itself.
EOF
Group Activity:
-
The composition of the Earth's atmosphere is a key component of
the Earth and the
biosphere.
- Nitrogen (N_2):
As you can see most of atmosphere is N_2
which is chemically rather inert. We breathe it in and out all the
time without any effect one way or the other.
But N_2 is necessary for life: it is used making in many organic compounds.
Both biological and non-biological methods of fixing nitrogen (i.e., converted to ammonia or nitrates) exist: see, e.g., Wikipedia: Nitrogen cycle.
- Oxygen (O_2) is needed for
respiration by
animals and
plants.
The main respiration reaction is C_6H_12O_6 + 6O_2 = 6CO_2 + 6H_2O + released energy where C_6H_12O_6 is glucose which is a sugar.(Fundamentals of Geology). - Carbon dioxide (CO2) is vital for plant
photosynthesis
and also as a greenhouse gas
(see Wikipedia: Carbon cycle).
Photosynthesis provides plants with energy and also substance---their mass largely comes from carbon from the air (Photosynthesis: Discovery). The latter point means that the most biomass that is NOT water (e.g., much of us) comes from carbon from the air via photosynthesis. Plants photosynthesize, animals eat plants, then animals eat animals---and that's the food chain for you.
The main photosynthesis reaction is 6CO_2 + 6H_2O + light energy = C_6H_12O_6 + 6O_2 where C_6H_12O_6 is glucose which is a sugar.(Fundamentals of Geology).The Earth's carbon cycle is illustrated in the figure below (local link / general link: carbon_cycle.html).
- Water vapor (H_2O gas) is highly variable since it readily condenses and evaporates to liquid and solid form under the conditions of the Earth's atmosphere.
-
This variability is also vital for life on Earth.
Most basically because salt sea water gets converted into fresh water on land through the hydrological cycle: i.e., evaporation from the sea and rain onto land.
- Methane CH_4 is also an important greenhouse gas although only a trace gas.
- Ozone (O_3) although a trace gas is important in the stratosphere where there is a concentration in the ozone layer at about 25 km (Se-439).
Ozone absorbs ultraviolet light from the Sun that is dangerous to life.
For penetration of ultraviolet through the atmosphere, see the figure below.
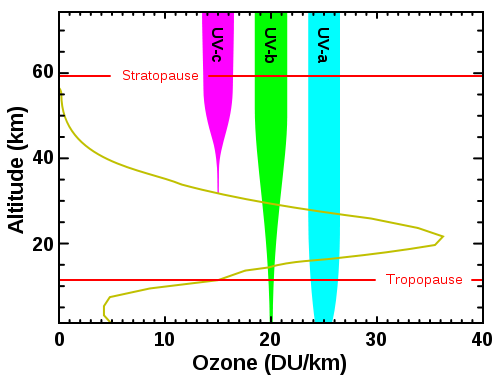
Caption: "Levels of ozone (O_3) at various altitudes, and related blocking of several types of ultraviolet radiation. The ozone concentrations shown are very small, typically only a few molecules O_3 per million molecules of air. But these ozone molecules are vitally important to life because they absorb the biologically harmful ultraviolet radiation from the Sun. There are three different types of ultraviolet (UV) radiation, based on the wavelength of the radiation. These are referred to as UV-a, UV-b, and UV-c. The plot also shows how far into the atmosphere each of these three types of UV radiation penetrates. We see that UV-c (red) is entirely screened out by ozone around 35 km altitude. On the other hand, we see that most UV-a (blue) reaches the surface, but it is NOT as genetically damaging, so we don't worry about it too much. It is the UV-b (green) radiation that can cause sunburn and that can also cause genetic damage, resulting in things like skin cancer, if exposure to it is prolonged. Ozone screens out most UV-b, but some reaches the surface. Were the ozone layer to decrease, more UV-b radiation would reach the surface, causing increased genetic damage to living things." (Slightly edited.)
DU/km are Dobson units per km---these are rather obscure units related to ozone concentration.
Credit/Permission: NASA, before or circa 2011 (uploaded to Wikipedia by User:Hardwigg, 2011) / Public domain.
Image link: Wikipedia: File:Ozone altitude UV graph.svg.
Chlorofluorocarbons (CFCs) used in refrigeration and air condition escape into the atmosphere and destroy ozone (Se-440). They are being phased out.
Unfortunately, H_2 (molecular hydrogen) can also destroy ozone. If we convert to a hydrogen economy, then H_2 leakage may become a significant environmental problem. The issue has been debated intensely recently.
-
Ozone at ground level produced by combustion in
industry and automobiles is also a pollutant and has
negative effects on the respiratory system.
See
How Ozone Pollution Works.
- NOBLE GASES argon (Ar), neon (Ne), helium (He), and krypton (Kr) are largely inert chemically. So they do NOT do much. However the study of them in isotope analysis is often important in understanding planetary system processes.
- OTHER TRACE GASES probably have some role, but we ignore them now and yours truly does NOT know anyway what that role is anyway.
- Water vapor (H_2O gas) is highly variable since it readily condenses and evaporates to liquid and solid form under the conditions of the Earth's atmosphere.
The table below specifies this composition.
_________________________________________________________________________

Earth Atmosphere Composition
_________________________________________________________________________

Gas                  Percentage by Mass              Percentage by Number
                             (%)                           (%)
_________________________________________________________________________


N_2 (nitrogen)              75.52                         77.
O_2 (oxygen)                23.14                         21.
Ar (argon)                   1.29                          0.99
CO_2 (carbon dioxide)        0.05                          0.033
Ne (neon)                    0.0013                        0.0018
He (helium)                 7*10**(-5)                   5.2*10**(-4)
CH_4 (methane)              1*10**(-4)                   1.5*10**(-4)
Kr (krypton)                3*10**(-4)                   1.1*10**(-4)
H_2 (hydrogen)                                           5*10**(-5)
O_3 (ozone)                                              4*10**(-5)
N_2O (nitrous oxide)                                     3*10**(-5)
CO (carbon monoxide)                                     1*10**(-5)
NH_3 (ammonia)                                           1*10**(-6)

H_2O (water vapor)         0.06 to 1.7                   0.1 to 2.8
   (Not counted in the atmosphere composition above.)

_____________________________________________________________________________

References: Se-439,
            CW-296, and
            Cox-258
            (but note Cox has the wrong exponents for some numbers).
____________________________________________________________________________
Now lets expand a bit on the components of the composition of the Earth's atmosphere.

-
The structure of the
Earth's atmosphere
is illustrated in the figure below
(local link /
general link: atmosphere_structure.html).
-
The Earth's atmosphere
exhibits both large-scale
fluid dynamics
and large-scale varying
thermodynamics.
Thus, the Earth's atmosphere has motion, both relatively steady and strongly vargying, and heat flow
The figure below (local link / general link: hadley_cell.html) explicates and illustrates the dynamic Earth atmosphere.
-
What is the greenhouse effect?
- Less.
- More.
- Neither more nor less.
- Both more and less.
It is the insulating effect of a planetary atmosphere that keeps the planet surface at a higher temperature than it would have if it simply re-emitted absorbed star flux like a single temperature radiator: i.e., a blackbody radiator.
The figure below (local link / general link: heat_flow.html) explicates the greenhouse effect by an everyday life analogy.
The mean temperature of the
airless Earth with the same
albedo as the actual
Earth
is calculated to be -19° C (254 K):
see the figure below
(local link /
general link: temperature_effective.html).
Question: Would the Earth be more
or less suitable for
its current life if its
mean temperature were -19° C?
The biosphere as it now
exists is set up for a higher mean temperature, and so
wouldn't work well if the
mean temperature were -19° C.
Answer 1 is right essentially.
Penguins might prefer -19° C.
Currently, the worldwide average is 15° C (288 K) (see Wikipedia: Instrumental temperature record: Absolute temperatures v. anomalies).
-
But if the greenhouse effect is basically good for us, why does
it have such a bad rep?
- The Industrial Revolution (c.1760--c.1840):
Beginning with Industrial Revolution (c.1760--c.1840), CO_2 in the atmosphere has been increasing.
The Industrial Revolution (c.1760--c.1840) is exemplified by the figure below.
Caption: An animation of the first kind of steam engine, the Newcomen engine (invented 1712).
The Newcomen engine has the essential ingredient of all heat engines: a hot reservoir (the fire), a cold reservoir (the ambient air), and a working substance (water both in liquid and steam form).
Heat engines turn heat energy into mechanical energy, but never with 100 % efficiency as dictated by 2nd law of thermodynamics.
From the primitive Newcomen engine sprang the glory and misery of the modern world.
Credit/Permission: User:Emoscopes, 2006 / Creative Commons CC BY-SA 3.0.
Image link: Wikipedia: File:Newcomen atmospheric engine animation.gif.
See Industrial Revolution videos below:
-
Industrial Revolution videos
(i.e.,
Industrial Revolution
videos):
- Turning Points in History - Industrial Revolution | 3:31: Good old films. Too long for the classroom
- Industrial Revolution (c.1760--c.1840) in pictures | 3:01: Good old pictures. Too long for classroom.
- History of steam engine | 8:56: Good old pictures. Too long for classroom.
- The World's First Steam Engine Working | 1:19: A full scale replica of the first kind of steam engine, the Newcomen engine. You can't see much. Too long for the classroom.
- Sussex Steam Model Newcomen Engine | 0:28: A toy version of the first kind of steam engine, the Newcomen engine, that had practical use. Short enough for the classroom.
- CO_2 Abundance:
).In 1760, CO_2 abundance was about 280 ppm (parts per million in air) which is about what it had been for millennia (and all of historical human history until 1760) (James F. Kasting, 1997 or after, The Carbon Cycle, Climate, And The Long-Term Effects Of Fossil Fuel Burning, scroll down ∼ 25%
Historical, CO_2 abundance values can be determined from air bubbles and other inclusions in ice cores drilled in Greenland, Antarctica, and other cold places.
See Ice core videos below/at link:
-
Ice core videos
(i.e., Ice core
videos):
- Antarctic Ice Core Drilling | 5:35: How it's done. Too long for the classroom, but a few minutes might be fun.
- Ice Core Secrets Could Reveal Answers to Global Warming | 4:59: Too long for the classroom, but informative.
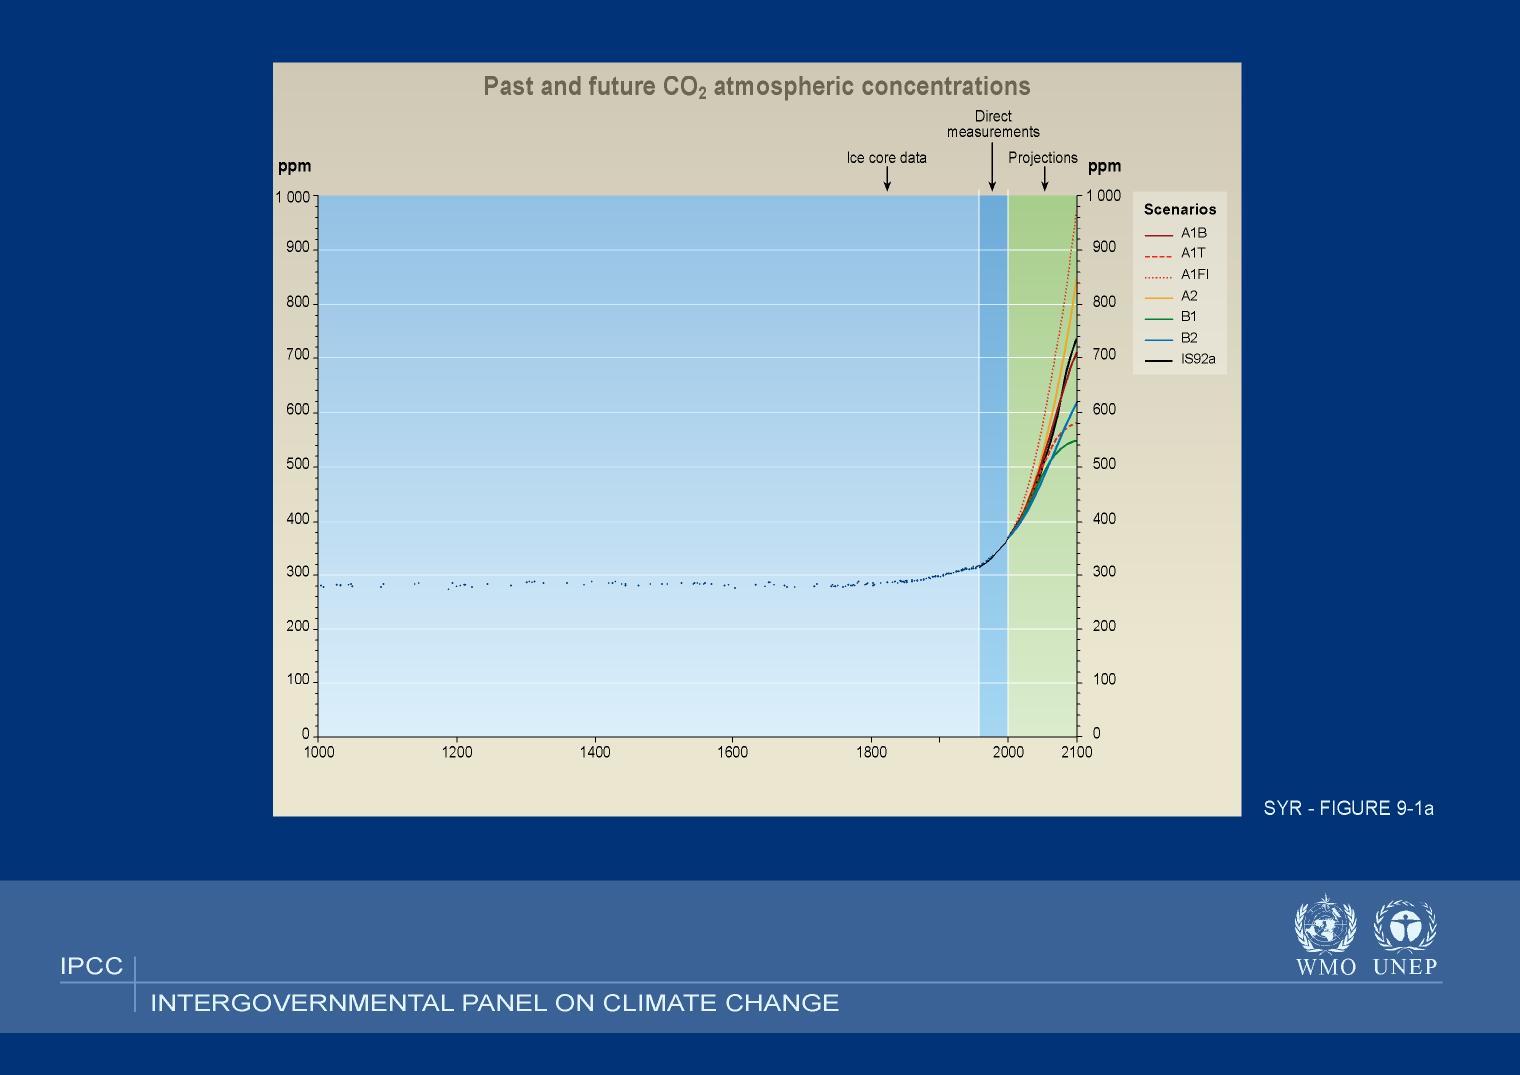
The figure below is what we find and what we predict for CO_2 abundance.
 Intergovernmental Panel on Climate Change (IPCC)
CO_2 records and predictions.
Intergovernmental Panel on Climate Change (IPCC)
CO_2 records and predictions.
Caption: The historical record back to 1000 CE is from ice core measurements.
Direct measurements have been done since about 1960 when abundance was 315 ppm. The last direct measurement on this plot was from 2000 when the abundance was about 370 ppm.
In various scenarios CO_2 abundance is seen to rise by varying amounts by 2100 The IPCC states that much of the variation is due to varying human response.
Actually many people think there is more uncertainty than the IPCC has found.
In 2011, CO_2 is/was about 390 ppm (Carbon dioxide in Earth's atmosphere) and since 1960 it has risen by about 22% (Wikipedia: Keeling curve). Probably by about 2015, the abundance will go above 400 ppm---which will be a bit of a psychological threshold.
Some people believe that anything above 350 ppm is dangerous---and we need to scrub the atmosphere.
In 2003, the increase was 3 ppm which is a record increase (Carbon Dioxide Reported at Record Levels). The recent average increase has been about 1.8 ppm
The increase amount does fluctuate, but it is plausible that the 2003 increase was caused by increased fossil fuel burning in Asia, particularly China and India.
Credit/Permission: © Intergovernmental Panel on Climate Change (IPCC), from publication Climate Change 2001 - Synthesis Report, IPCC, SYR-Fig. 9-1a, 2001 / IPCC with correct credit.
Image link: Itself.
Keeling curves (carbon dioxide (CO_2) abundance versus time plot) showing the period 1958--present and the last 5 years are shown in the figure below (local link / general link: keeling_curve.html).
- Increasing CO_2 Abundance and Global Surface Temperature:
).There is no doubt that the CO_2 increase since the beginning of the Industrial Revolution (c.1760--c.1840) is primarily caused by the burning of fossil fuels (i.e., coal, oil, and natural gas).
When we burn these fuels, we release CO_2 where the carbon component has been locked up in the ground as organic fossil fuel for geologically long times: millions to hundreds of millions of years???.
Of course, CO_2 is always being released and absorbed from the atmosphere by a variety of processes which collectively form the Earth's carbon cycle:
SOURCES:
- respiration.
- decomposition of organic materials including human deforestation.
- fossil fuel burning.
- volcanic outgassing. A slow, long-term process.
SINKS:
- photosynthesis which locks carbon up in plants and the animals that feed on them.
- dissolution in the oceans ultimately leading to some carbon from CO_2 being bound up in sedimentary rock as calcium carbonate (CaCO_3) (CW-193). A slow, long-term process.
The combination of these sources and sinks is the Earth's carbon cycle which is illustrated in the figure below (local link / general link: carbon_cycle.html).
Nevertheless, some fraction of the CO_2 we produce stays in the atmosphere for centuries: about 65 % according to some calculations (James F. Kasting, 1997 or after, The Carbon Cycle, Climate, And The Long-Term Effects Of Fossil Fuel Burning, scroll down ∼ 10%
The SIMPLE prediction is that if you increase a greenhouse gas, you should increase the greenhouse effect and cause global warming. This prediciton was first made by Svante Arrhenius (1859--1927) in 1896.
But climate is NOT simple.
There are all kinds of complex FEEDBACK MECHANISMS and also other effects such as increasing dust pollution which can increase reflection of sunlight and cause GLOBAL COOLING.
Nevertheless, CLIMATE MODELING does predict that increased CO_2 combined with other effects will lead to global warming---but there are still great uncertainties.
In the 20th century---of fond memory---it seems that the GLOBAL MEAN temperature rose by 0.6 ± 0.2 K (see Wikipedia: Instrumental temperature record).
It is NOT easy to meaure GLOBAL MEAN temperature especially going back in time, and so that value may be more uncertain than indicated.
The GLOBAL MEAN temperature can be reconstructed from historical measurements and natural records like ice cores from ice caps in Greenland, etc. See figure below.
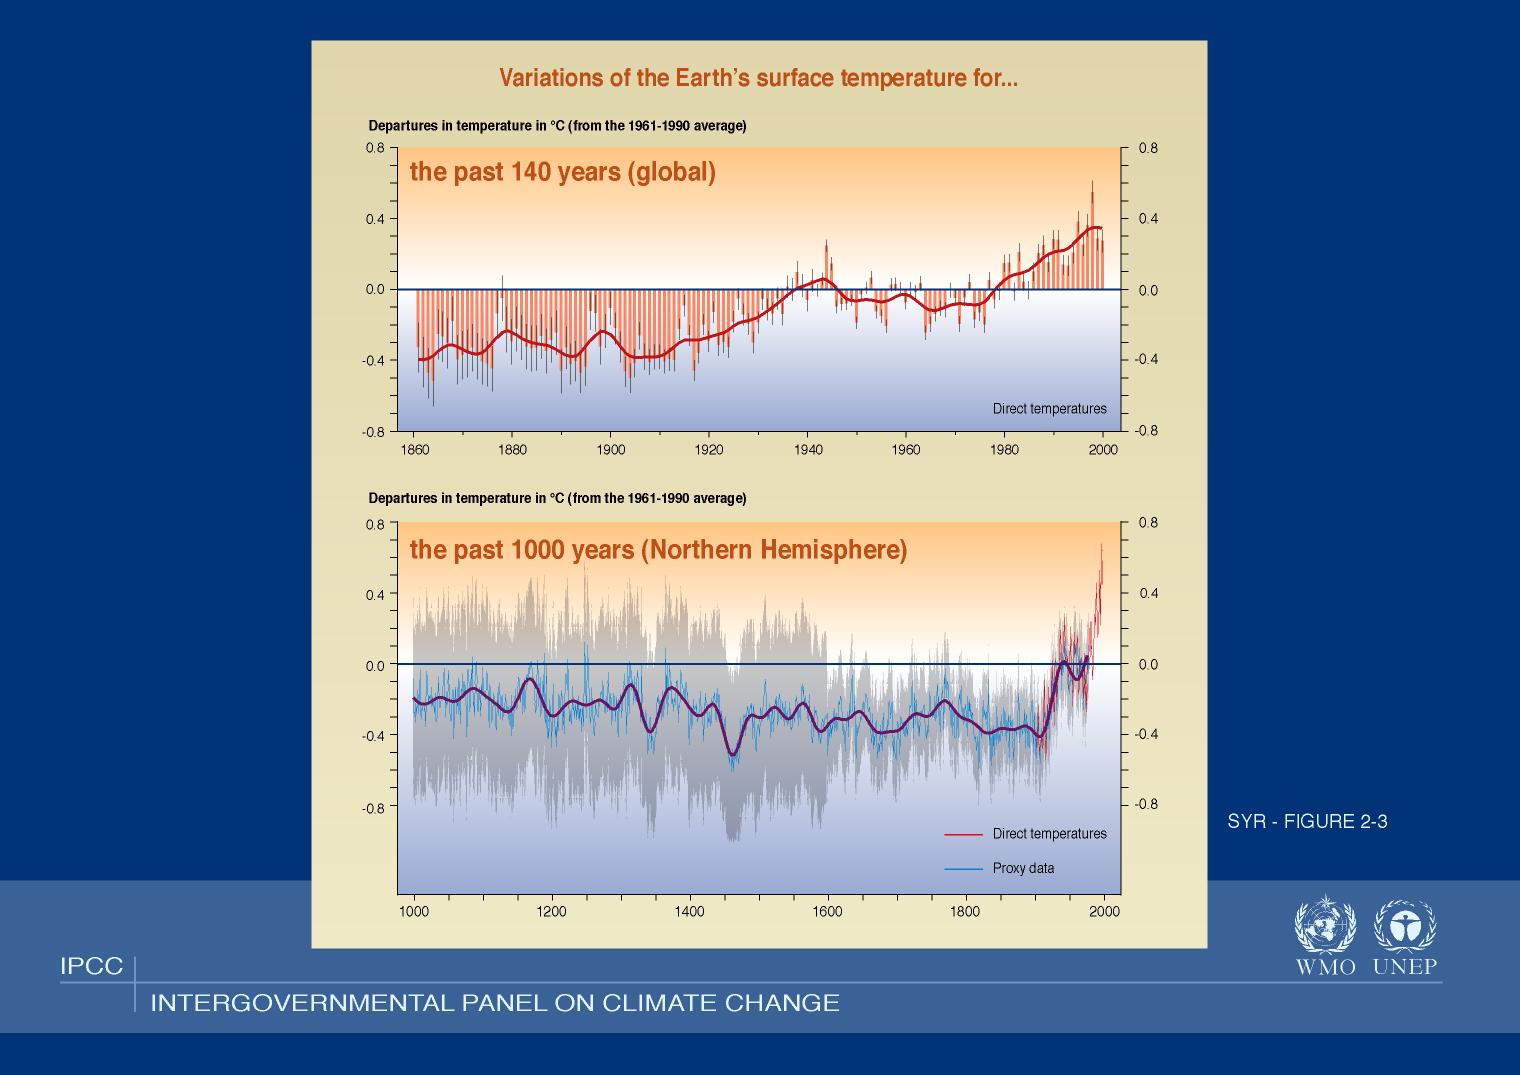
Caption: Annual global mean temperature relative to the mean 1961--1990 temperature.
The grey region on the lower plot indicates the range of uncertainty???. It is considerable, and so it is NOT certain that temperatures were generally cooler over the 2nd millennium.
The shape of this curve has been called the hockey stick.
Since the curve was first published in about 1999, there have been many other calculations with widely different results for the past millennium. They all pretty much agree, however, that the Earth after 1980 has been warmer than any time since 1000 AD (reporter, 2005, Science, February 11, 307, 828).
Credit/Permission: © Intergovernmental Panel on Climate Change (IPCC), from publication Climate Change 2001 - Synthesis Report, IPCC, SYR-Fig. 2-3, 2001 / IPCC with correct credit.
Image link: Itself.
The GLOBAL MEAN temperature varition does NOT show, of course, the complex local temperature variation.
We must look at other data representations for that. See figure below.
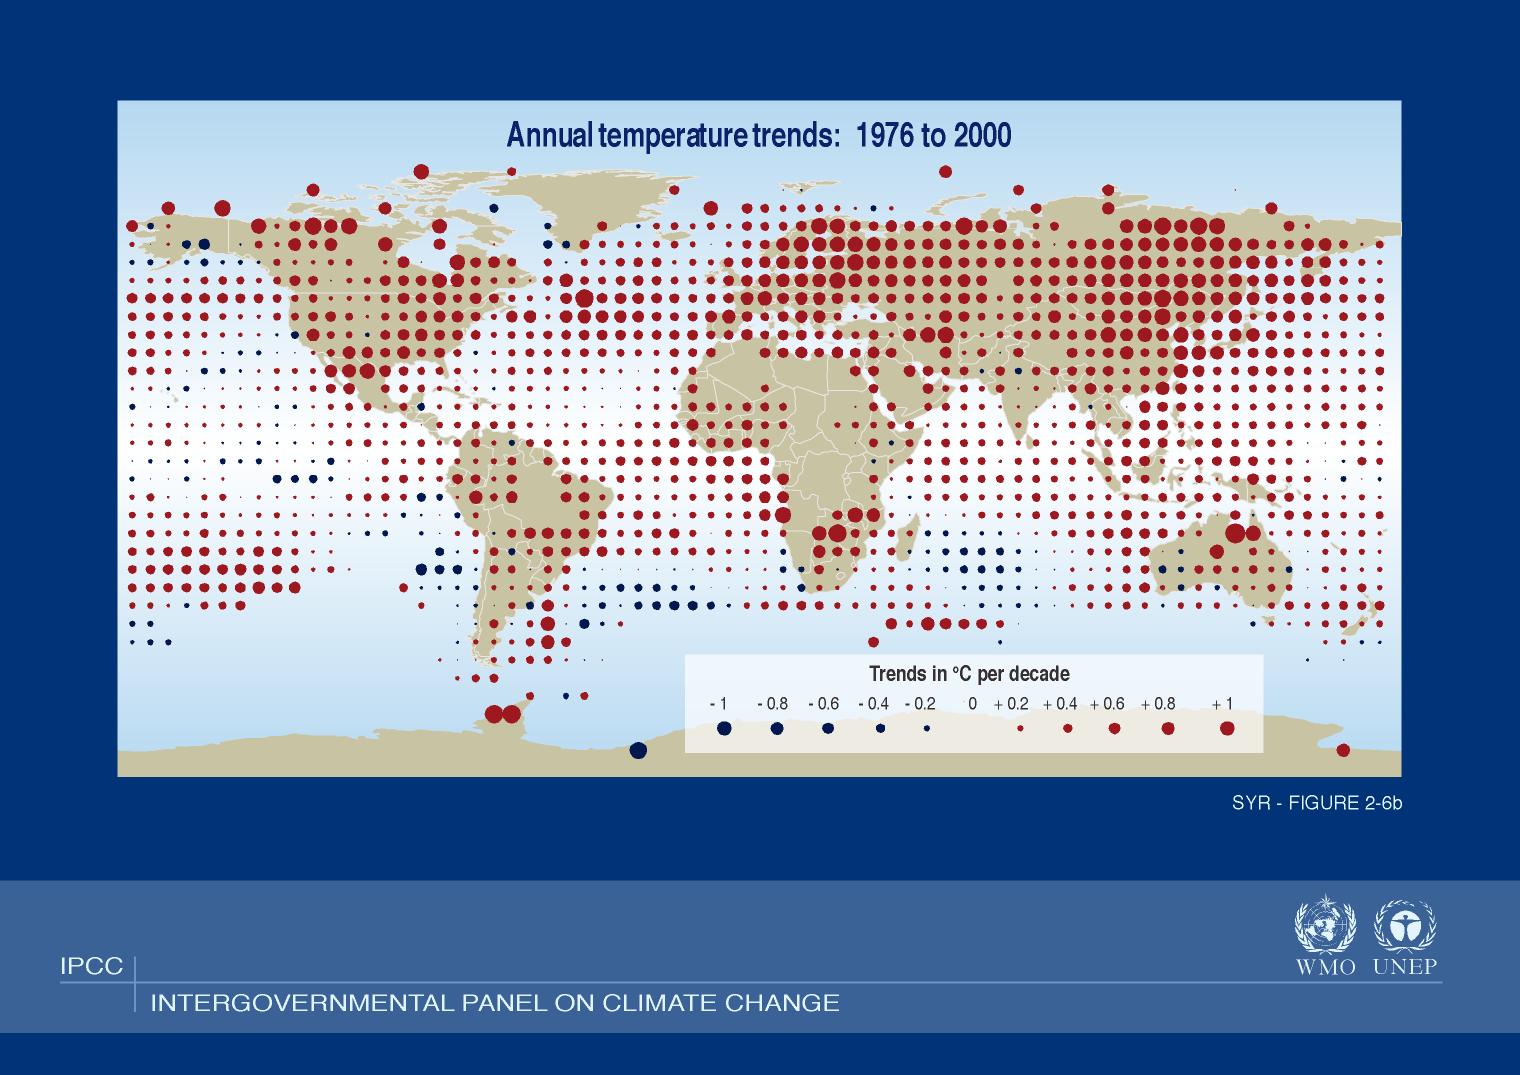
Caption: Annual temperature trends all over the Earth for 1976 to 2000.
The dots indicate the increase in annual temperature per decade averaged over the period 1976--2000.
As one can see, temperature change has NOT been uniform, but has been rather complex. Some regions have even gotten colder.
Non-uniform change is probably what we can expect for the future.
Credit/Permission: © Intergovernmental Panel on Climate Change (IPCC), from publication Climate Change 2001 - Synthesis Report, IPCC, Fig. 2-6b, 2001 / IPCC with correct credit.
Image link: Itself.
Is the temperature change of the 20th and early 21st centuries anthropogenic or just a natural fluctuation?
The Intergovernmental Panel on Climate Change (IPCC) has given their conclusion. See figure below.
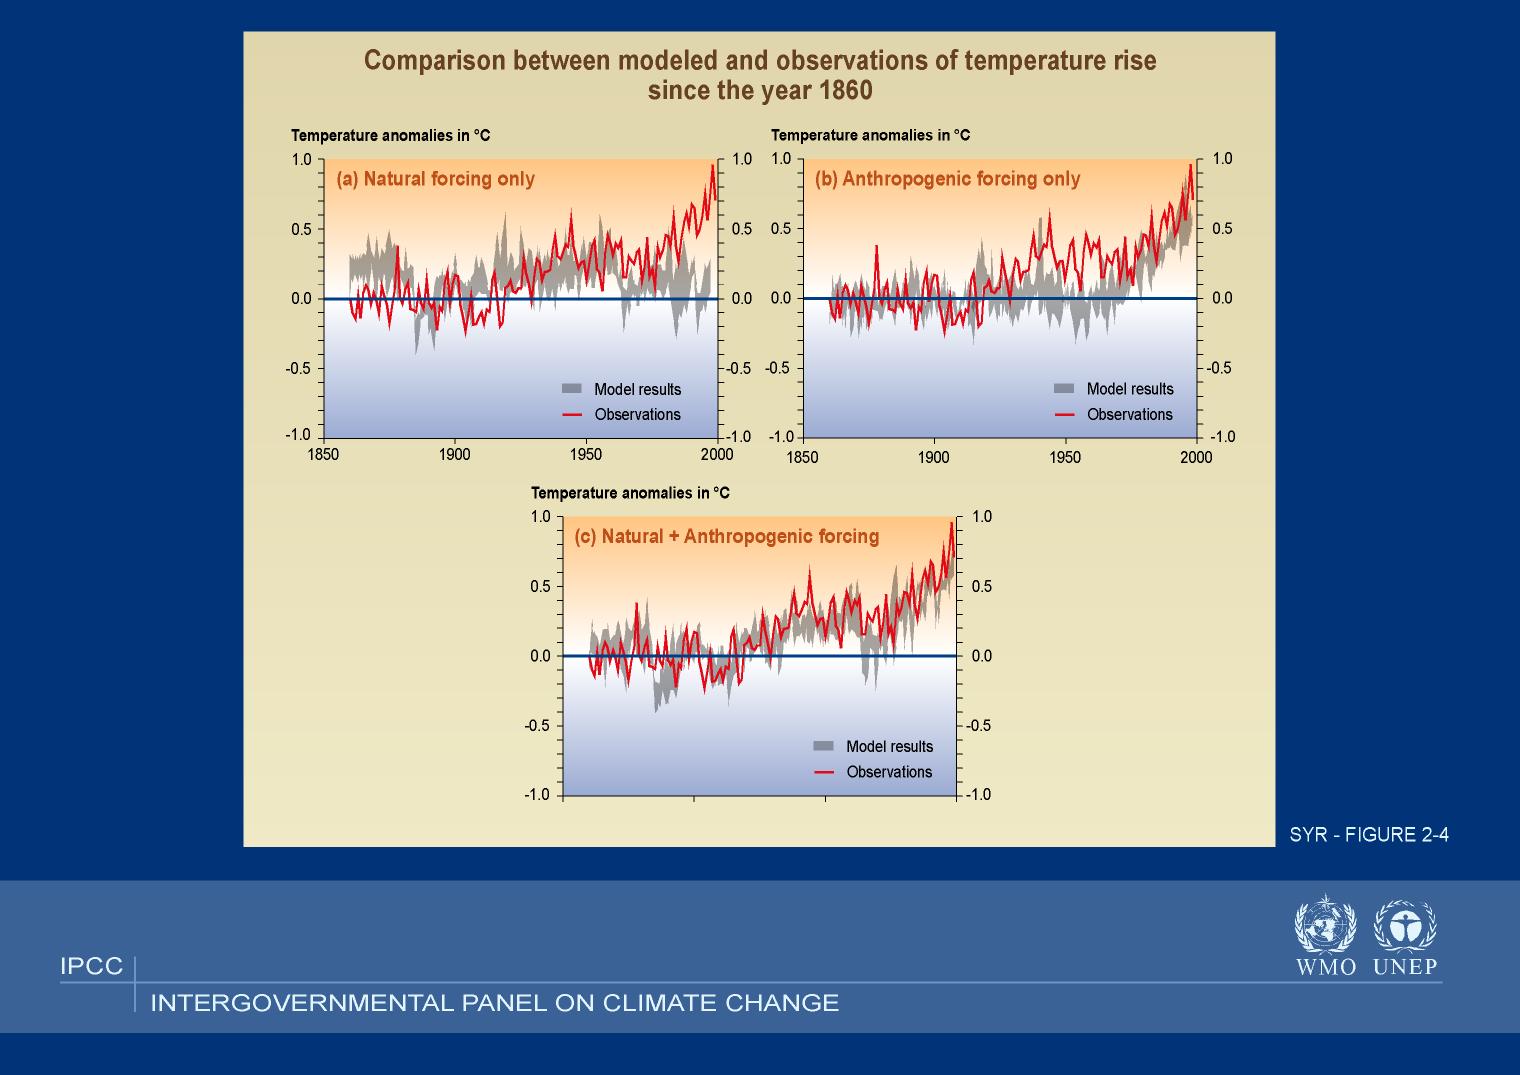
Caption: A comparison of models with measured temperature.
The comparison shows models with natural, anthropogenic, and combined forcing for 1860--2000.
The grey region for the model results indicates the range of uncertainty in the model predictions.
An objection in the past to computer model climate predictions was that they could NOT fit the PAST, and so how could you believe them for the FUTURE.
Well now they can fit the PAST.
But how many free parameters have been used?
You can always fit any curve if you adjust the unknown controls (i.e., free parameters). I guess one could find out.
But in any case, it is significant evidence that global warming (AKA anthropogenic climate change) is occurring.
The evidence has firmed up since this figure was generated 5 or so years ago.
There is still lots of uncertainty though.
It seems every year or so, there's a wups moment when something is discovered NOT to have been modeled adequately.
But so far those wups moments have NOT changed the qualitative conclusions much.
Credit/Permission: © Intergovernmental Panel on Climate Change (IPCC), from publication Climate Change 2001 - Synthesis Report, IPCC, SYR-Fig. 2-4, 2001 / IPCC with correct credit.
Image link: Itself.
- The Future of Global Surface Temperature:
What about the future of global surface temperature?
Circa 2022, the IPCC predicts temperature changes from Pre-industrial Era (before c.1760) when global surface temperature was ∼ 14°C due to doubling the carbon dioxide (CO_2) abundance from the Pre-industrial Era (before c.1760) ∼280 ppm to 560 ppm: transient climate response (TCR) 1°C to 2.5°C and equilibrium climate sensitivity (ECS) 2.5°C to 4.0°C with best estimate 3°C.
These predictions are based computer simulations and climate and paleoclimate data.
Note, there is still considerable uncertainty.
The IPCC does their best, but there are objectors to their predictions outside (and even inside) their ranks---but the objectors go both ways---from "why worry" to "apocalypse now".
See figure below for the range of predictions of GLOBAL MEAN temperature from a somewhat out-of-date modeling.
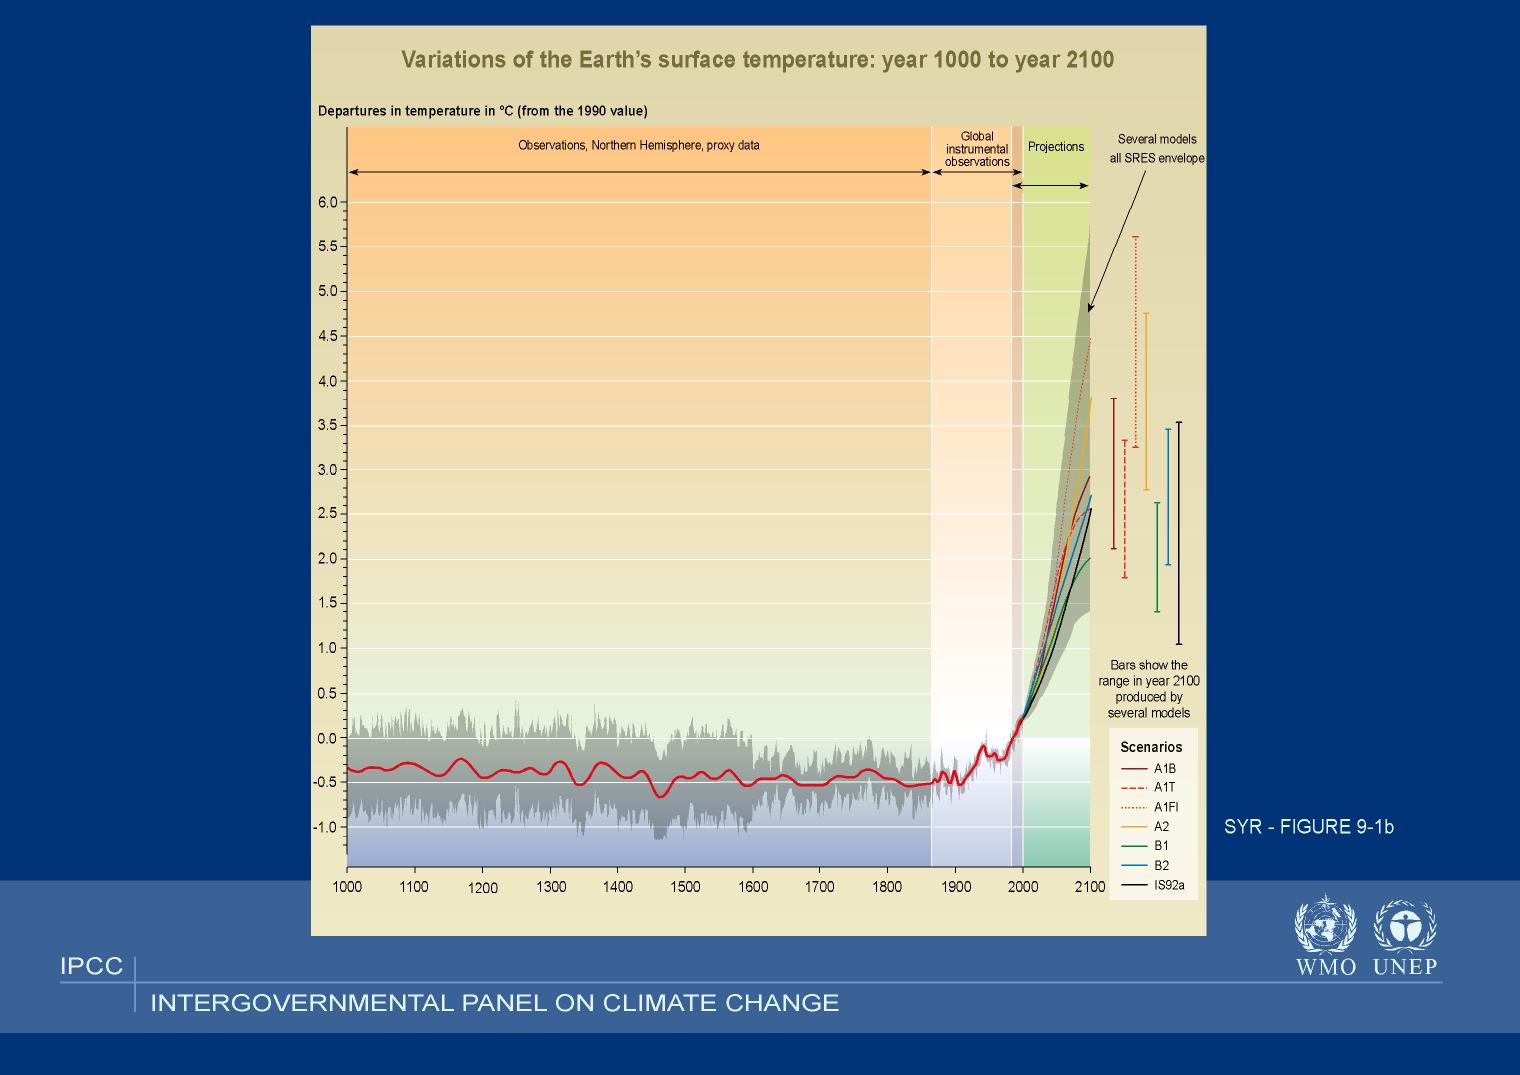
Caption: IPCC predictions for temperature increase.
The temperatures are relative to the 1990 global mean temperature.
Under various circumstances the mean global temperature is seen to rise by varying amounts in the next 100 years.
The IPCC states that much of the variation is due to varying human response.
Actually many people think there is more uncertainty than the IPCC has found.
Credit/Permission: © Intergovernmental Panel on Climate Change (IPCC), from publication Climate Change 2001 - Synthesis Report, IPCC, SYR-Fig. 9-1b, 2001 / IPCC with correct credit.
Image link: Itself.
Climate is complex and subject to many natural processes which are NOT yet fully predictable.
If there is significant future global warming, what are some possible consequences?
- Well global mean temperature rise can have a large range of
varying consequences depending on region: some regions will
get hotter than the average; some colder.
- Ecosystems will be disrupted which usually means there will be
winners and losers in the natural world.
But the overall biosphere is likely to be loser in that complex ecosystems might be devastated.
- Agriculture might suffer overall although in some regions
(e.g., Siberia) there might be pluses.
- Ocean water will expand with heating and probably some of the world's ice caps will partially melt increasing
sea level by perhaps 0.09--0.88 meters in the time frame
(NOAA: Global Warming Frequently Asked Questions).
There already has been some significant sea level rise since 1880 and more is expected. See the two figures below (local link / general link: sea_level_rise.html; unlinked).
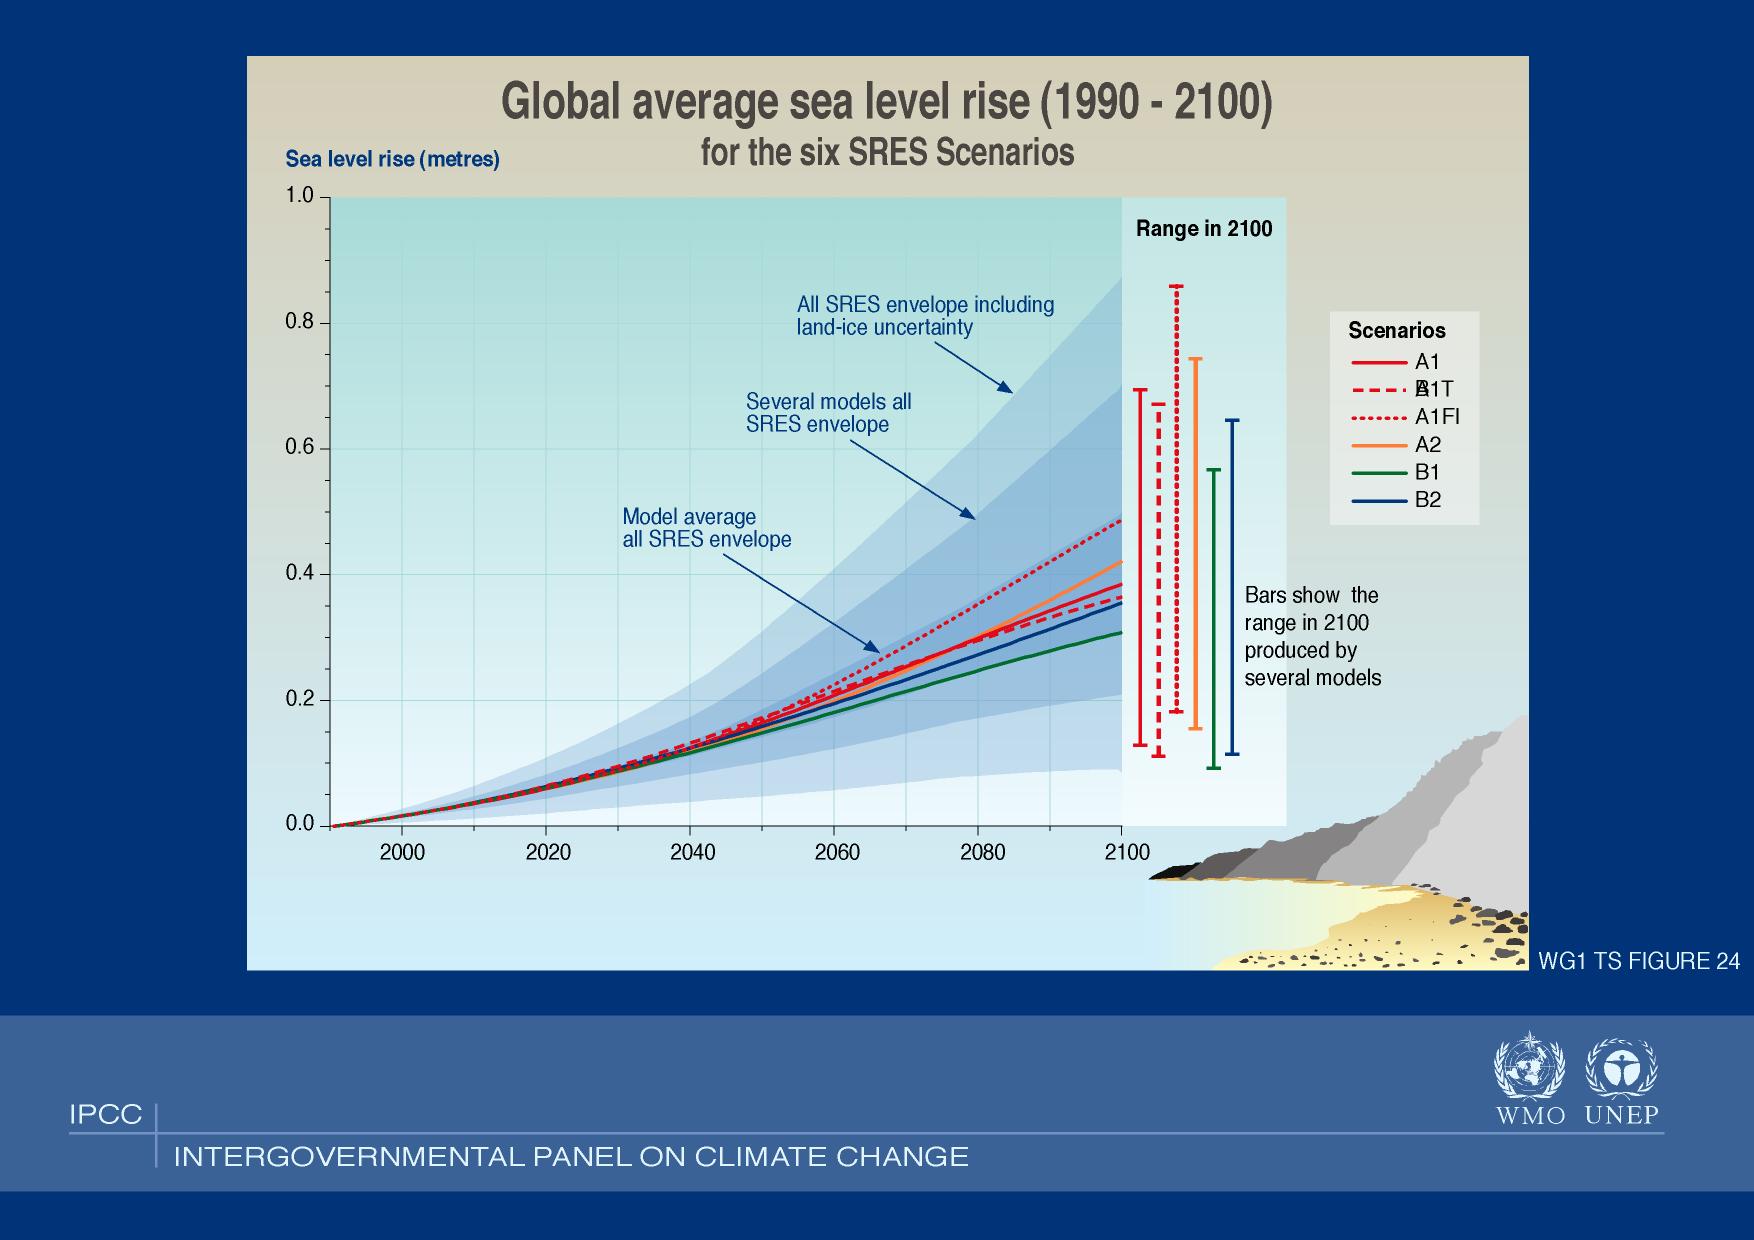
Caption: IPCC predictions for the rise in mean sea level.
They present 6 models that depend on varying circumstances many of which are under human control. There also uncertainty envelopes.
Many people believe that the uncertainties are greater than the IPCC estimate.
Credit/Permission: © Intergovernmental Panel on Climate Change (IPCC), from publication Climate Change 2001 - Working Group I - The Scientific Basis, IPCC, WG1 TS Fig. 24 / IPCC with correct credit.
Image link: Itself.
Some low-lying island nations (and southern Florida) could suffer severely with the maximum sea level rise predicted in some scenarios. Naturally, these places are NOT happy about this prospect.
- What Should Be Done?
What should be done? This is a policy question.
- Some think that radical action should be taken.
- Some think the science is still too uncertain to take radical action yet.
- Some think we should just adapt come what may. This is the way
we've always reacted to climate change in the past.
-
Intergovernmental Panel on Climate Change,
NOAA: Global Warming Frequently Asked Questions,
GLOBAL WARMING: Early Warning Signs. - The article
James F. Kasting,
1997 or after, The Carbon Cycle, Climate, And The Long-Term Effects Of Fossil Fuel Burning
is out of date, but presents useful discussion of the science and economics.
- Indoor carbon dioxide levels could be a health hazard, Guardian, 2019jul08:
1000 ppm could be bad for human and animal health,
and many human and city environments could reach that level by
2100 all the time.
- Deepak Ray, Climate change is affecting crop yields and reducing global food supplies,
2019 July 9:
Climate change
is decreasing food yields and increasing world hunger since 2014 or so.
- See Global warming videos
below/at link:
-
Global warming videos
(i.e., Global warming
videos):
- Climate change just hit home NBC, 2014 | 26:15: Way too long for the classroom.
- How does the climate system work? Met Office | 3.51: Covers the greenhouse effect. Too long for the classroom.
- NASA | IPCC Projections of Temperature and Precipitation in the 21st Century | 3:53: Too long for the classroom.
- NASA | Piecing Together the Temperature Puzzle, 2010 | 5:48: Uses the Fahrenheit scale. Too long for the classroom .
- NASA | A Year in the Life of Earth's CO2, 2014 | 3:10: Too long for the classroom .
It's the Goldilocks predicament---the greenhouse effect has to be just right---or at least it should stay mostly the way it has been through most of the Holocene (∼ 11,700 BP--present).
-
Note, Before Present (BP) uses
year 1950 as "Present", but "present" is
right now.
Note, before the Holocene (∼ 11,700 BP--present) was the Pleistocene (2,580,000--11,700 BP) and the two together are the Quaternary (2.580 Myr BP--present). The Pleistocene (2,580,000--11,650 BP) is also the fiducial end of the Last Glacial Period (115,000--11,700 BP) of the Quarternary glaciation (2.580 Myr BP--present) which is still going on. The Next Glacial Period (maybe 50,000---100,000 years AP = after present). So the continental ice sheets will return---but NOT soon enough to save us from global warming.

-
The Earth at formation was probably too hot and too often impacted
by large protoplanets and
planetesimals
to hold much of an atmosphere or oceans.
- The hotter gas atoms and molecules are the higher their
speed. In the low density upper atmosphere, the
hottest particles can reach
escape velocity and just
fly off into space.
This is usually a slow leaking process, but over millions or billions of years an atmosphere can be diminished.
The lightest particles have the highest speed, and so have the strongest tendency to escape. Note, the Earth doesn't have much molecular hydrogen gas or helium gas.
- Major impacts can literally shock the atmosphere off
a planet (Ahrens lecture, 2003oct).
-
Where Did the Earth's Atmosphere Come From?
Earth rock contains volatile element atoms trapped in the rock. Small amounts compared to the rock/metal mass of the Earth, but enough to give us atmosphere and oceans.
These volatiles are continually released by volcanic activity: they tend to be released when the rock is melted and spewed on to the surface of the Earth.
This process is called volcanic outgassing.
-
There is a theory that comets brought significant
volatile
material, particularly water,
to the Earth in some early phase---"a hard rain fell".
This theory has had its ups and downs in acceptance.
At present, theory that comets from the Kuiper belt brought most water to Earth seems to be gaining ground.
-
Recently, it has been argued that hydrogen gas (H_2) might
have made up 30 % of the early atmosphere and that his gas
would have promoted organic molecule formation
(Hecht, J. 2005, New Scientist, April 16, 17).
See the figure below illustrating volcanic outgassing.
- Liquid Water:
But how did we get to the happy atmospheric state we enjoy now? Happiness being having a warm puppy---no, happiness is having liquid water.
The Goldilocks principle has helped us:
-
"Hm" said Goldilocks:
"Primordial Venus is too hot for liquid water."
"Primordial Mars (or Mars sooner rather than later) is too cold."
"But primordial Earth is just right."
And liquid water is all important for life as we know it and it exists only in a narrow temperature range and only if pressure is greater than about 0.01 atmospheres (i.e., 1 atmosphere is current Earth sea level atmospheric pressure which is about 10**5 Pascals.) See this water phase diagram.
-
Question: Why is liquid water important for
life as we know it?
- Water is an important facilitator of biological processes
and the medium in which many of them occur.
- Much of living tissue is actually just water. By mass, human males
are about 60 % water and human females about 55 % water
(Wkipedia: Human body water).
- All life as we know it
depends on liquid water and CANNOT
exist in its absence.
All the answers are right and, in fact, are NOT independent.See references Water health FAQ Frequently Asked Questions and Water for human beings
As you know some life has evolved to live outside of the ocean, but it maintains its own internal ocean.
- Another Reason for Needing Liquid Water:
Another reason for needing liquid water is get rid of the large CO_2 abundance and to prevent a runaway greenhouse effect (similar to what happened on Venus).
The early Earth needed more greenhouse effect than now since the Sun was about 30 % less bright 4.6 Gyr ago (WB-106).
So considerable atmospheric CO_2 was needed to keep Earth warm enough for life and liquid water.
-
Actually, getting the early Earth warm enough
for liquid water has proven a challenge for the
Earth modelers.
The theoretical result that the Sun was about 30 % less bright 4.6 Gyr ago (WB-106) seems as sure as a purely theoretical result can be.
But maybe there is something we do NOT understand about the early Sun or the early.
Or maybe we don't understand the early Earth well enough.
The problem with making the theories consistent on this point is called the faint early Sun paradox.
-
An aeon is an indefinitely large period of time in
casual discourse.
In geology,
an eon it is formally the 2nd
largest division of geologic time comprising two or more eras and lasting half a gigayear or more.
In fact, Earth history seems to be divided into only
4 eons: going back in time we have the
Phanerozoic (0.570--present),
Proterozoic (2.50--0.570 Gyr),
Archean (4.0--2.5 Gyr)
and
Priscoan (4.57--4.00 Gry)
(Cox-249).
This is what happened to Venus which has surface atmosphere pressure about 92 times that of Earth, an atmosphere that is 96.5 % CO_2 by (number???), and a mean surface temperature of 735 K (i.e, 462 C)---which as people always note is hot enough to melt lead (melting temperature 600.61 K at Earth surface pressure and probably a bit higher on Venus).
-
... All hope abandon ye who enter here."
Such characters in colour dim I mark'd
Over a portal's lofty arch inscrib'd:
-
---Dante Alighieri (1265--1321), Inferno, transl. H. F. Cary
(Project Gutenberg's Dante's Inferno).
After early times when a CO_2 atmosphere first built up, it seems that carbonate rock production has usually outpaced CO_2 volcanic outgassing.
CO_2, which was once a dominant atmospheric species, has dropped to being a trace species.
400 Myr ago, CO_2 abundance was still about 20 times what it is today (WB-62), but even that was only about 0.7 % by number of the atmosphere.
Now it is only about 0.033 % by number.
- The Return of the Glaciers:
Anthropogenic release of CO_2 from fossil fuels created by ancient life CANNOT stop the return of the glaciers.
But over a millennium or two the CO_2 abundance would come back to about where it was before the Industrial Revolution (c.1760--c.1840), because the oceans tend to absorb it up to some saturation limit (Ka-60%).
So anthropogenic global warming is only a temporary problem. It's NOT going to save us from the next glacial period of the current ice age (i.e., Quarternary glaciation (2.580 Myr BP--present)) which started circa 2.58 Myr ago and isn't over as far as we know (WB-76).
We are just in an interglacial period which started circa 12,000 years ago and may well end in a few tens of thousand more (see Next Glacial Period (maybe 50,000---100,000 years AP = after present)).
For some details of the Quarternary glaciation (2.580 Myr BP--present), see the figure below (local link / general link: quarternary_glacial.html).
- What's in Store in Next Gigayear for CO_2?
On a much longer time scale than that of the current ice age, the Sun is still brightening---as the figure below illustrates---and thus increasing the heating the Earth.
-
Like most chemical reactions, chemical weathering should
speed up with increased heat.
Another doomsday scenario---there are so many of them.
- Where Did the O_2 Come From?
Where did the O_2 come from?
First, note that O_2 is a highly reactive gas and would relatively quickly disappear over megayears or hundreds of megayears if it weren't being continually produced (HI-125). It reacts to form oxides like rust (HI-125).
Our current oxygen-rich atmosphere could never be established from volcanic outgassing???.
-
Question: What did give rise to most of the O_2 in the
atmosphere?
- It fell in from outer space.
- Spontaneous generation.
- It is a product of photosynthesis.
Answer 3 is right.Of course, rather inert N_2, NOT O_2, is the dominant species presently.
N_2 must have taken over as dominant species as CO_2 dropped due to carbon becoming locked in carbonate rock and also due to O_2 production from plants.
- The Fate of Water:
Water was produced by volcanic outgassing or a hard comet rain as noted above and mostly became our oceans.
What is the fate of water?
At present, up to about 12 km above sea level---the exact altitude varies with latitude---is the troposphere.
The troposphere is lower atmosphere in which our weather occurs (WB-138). The upper boundary of the troposphere is the tropopause. There is relatively little mixing of air through the tropopause.
At the top of the troposphere the temperature is about 208 K (WB-137) and water vapor that air can contain there is very tiny.
Most water will condense out and fall inside the troposphere.
Thus, convection cells in the troposphere can't carry water up to great altitudes above the troposphere.
But the order of one gigayear, the brightening of the Sun will cause the mean global surface temperature to reach about 70 degrees C (or 340 K) and then the troposphere will extend to over 100 km in altitude (WB-129,138) which means (although we omit the argument) that water vapor will be convected up to over 100 km in altitude????.
At those altitudes, UV radiation from the Sun is available to break H_2O into H and O.
A much greater fraction of H atoms will then escape the atmosphere by having escape velocity than they do now.
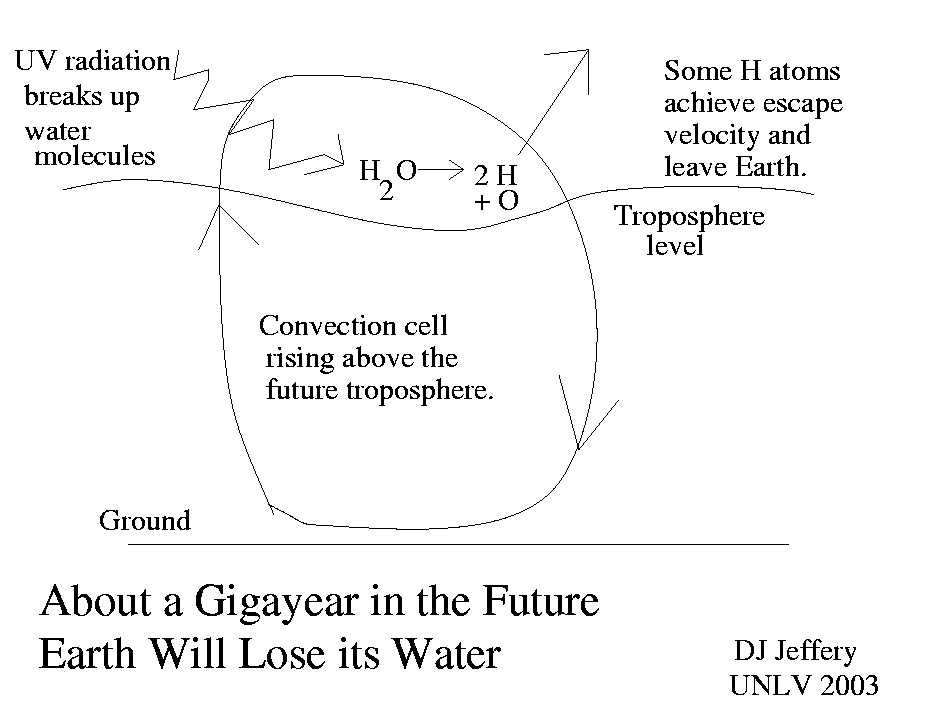
Caption: A cartoon of Earth losing its water in the future.
Credit/Permission: © David Jeffery, 2003 / Own work.
Image link: Itself.
The future conditions of the Earth after massive H_2O loss begins are hard to predict, but the oceans might be gone by 1.5 Gyr ???? (WB-142).
Some liquid water could remain due to the still-ongoing volcanic outgassing (WB-141). And so some primitive life could persist in ponds.
But sooner or later the Earth will get too hot for liquid water and life will end---at least life as we know it.
Perhaps some exotic evolution will preserve complex life---or hyper-intelligent beings of the future might transcend mere physical limitations.
When the liquid water gone or sufficiently gone, CO_2---which disappeared into calcium carbonate deposition mainly in liquid water---could make a comeback. Volcanic outgassing without competition from calcium carbonate deposition could give the Earth a rich CO_2 and then Earth would go the way of Venus.
Of course, the end of the Sun's main sequence life as discussed in IAL 9: The Life of the Sun spells the doom of the Earth anyway in 5 to 6 Gyr.
- Liquid Water:
-
The history of life on Earth
is too big a topic for
IAL 11: The Earth.
However, we briefly touch on
earliest history
of life on Earth
in the figure below
(local link: )
Local file: local link: .
see the figure below
(local link /
general link: earth_archean_eon.html).
-
We could go on discussing Earth topics---like the weather, but everyone
talks about the weather.
Then there are 1970s rock bands . . .
But to conclude, the Earth is an evolving place.
Anatomically modern humankind have been around only since ∼ 200--300 kyr BP (see Wikipedia: Anatomically modern human; Wikipedia: Jebel Irhoud), but even that has seen two or three interglacials including the present one (see Wikipedia: Interglacial).
But the really big changes, we only contemplate philosophically. They are outside of the time scale of human society.
We breach the time barrier to the far past and far future---deep time---only by scientific inference.
Form groups of 2 or 3---NOT more---and tackle
Homework 11
problems 25--30 on
the greenhouse effect.
Discuss each problem and come to a group answer.
Oh, 5--10 minutes.
See Solutions 11.
The winners get chocolates.
Group Activity: