The large-scale structure includes galaxies, galaxy groups (see the figure of Seyfert's Sextet above: local link / general link: seyfert_sextet.html; and below: local link / general link: seyfert_sextet.html), galaxy clusters, galaxy superclusters, galaxy filaments, galaxy walls, voids, and whole lot more.
The study of the large-scale structure is considered part of cosmology, but it is at a level just below that of the observable universe as a whole---which we will study in IAL 30: Cosmology.
Features:
Since NGC 6027d is ∼ 5 times farther away than the other 5 galaxies, it is NOT surprising that it has apparent size ∼ 1/3 of those others. That the apparent size is NOT ∼ 1/5 of the others must be because it is intrinsically a larger galaxy.
The "D" in Scd D may mean D galaxy (i.e., diffuse galaxy), but no one's telling.
Recall NGC 6027d is the background galaxy at distance ∼ 269 Mpc.
Peculiar galaxies are just a bit more peculiar than most.
Interacting galaxies are galaxies sufficiently close in space that their mutual gravity distorts their structure. Usually interacting galaxies are gravitationally bound, but "it ain't necessarily so."
There are 4 simple characteristics that mark interacting galaxies:
Of course, some interacting galaxies may have none of these characteristics in any obvious way. It is hard to tell in some cases if galaxies are interacting galaxies.
There are NO obvious tidal tails in this image.
There are some units and distance scales that it is convenient to note or recapitulate for a start. See the listing in the insert below (local link / general link: astronomical_distances_larger.html).
The value since 2012 has been exact by definition and it is very close to exactly the mean Earth-Sun distance AKA the semi-major axis of the Earth's orbit.
The light-year is the distance light at the vacuum light speed c = 2.99792458*10**8 m/s ≅ 3*10**8 m/s = 3*10**5 km/s ≅ 1 ft/ns travels in 1 Julian year (Jyr) ≡ 365.25 days ≅ π*10**7 s.
It is the distance to an astronomical object (usually a star) that has a parallax (a stellar parallax for star) of 1 arcsecond ('') for a baseline of 1 astronomical unit (AU). For a complete explication of how the parsec is arrived at, see Star file: parallax_stellar.html.
For example, the Milky Way disk diameter (by some conventional metric) is ∼ 30 kpc. However, dwarf galaxies have a much smaller size scale. Currently, the smallest known are ultra-compact dwarf galaxies with a size scale of order 0.1 kpc. One should also consider galactic halos for non-dwarf galaxies: stellar galactic halo have size scales ∼ 50--100 kpc (e.g., FK-566); dark matter halos (which are set by dark matter) have size scales of ∼ 100--200 kpc (e.g., FK-566).
For example, the Andromeda galaxy (M31, NGC 224) (the closest non-dwarf galaxy) is at 0.778(33) Mpc (see Wikipedia: Andromeda galaxy).
Note the value of comoving radius of the observable universe is model-dependent result. It depends on the fiducial Λ-CDM model which fits the observable universe well (see, e.g., Scott 2018), but may be replaced even in the near future relative to 2025. Note also that one definition of the local universe (but certainly NOT the only one), and thus also the modern observable universe, gives it a radius of ∼ 5 Gly ≅ 1.5 Gpc and a lookback time from cosmic present of ∼ 5 Gyr which is roughly the age of the Solar System---and remember "humankind is the measure of all things" as said Protagoras (c.490--c.420 BCE).
Local file: local link: astronomical_distances_larger.html.
File: Cosmology file:
astronomical_distances_larger.html.
To explicate, see the artist's conception of the observable universe in the figure below (local link / general link: cosmos_logarithmic_map.html).
Caption: Artist's conception on a quasi logarithmic scale of the observable universe (that part of the universe inside of our past light cone). Going outward from the center at the Sun, are the Solar System inner planets (inner Solar System), the Solar System outer planets (outer Solar System), the Kuiper belt, the Oort cloud, Alpha Centauri, the Perseus Arm, the Milky Way, the Andromeda galaxy (M31, NGC 224), nearby galaxies, the large scale structure (which is sometimes now called the cosmic web), the cosmic microwave background (CMB), and the Big Bang's invisible plasma on the edge.
Features:
Note the original cosmic background radiation at the recombination era (∼ 378,000 years after the Big Bang) that evolved to be CMB (which is invisible in the visible band (fiducial range 0.4--0.7 μm)) had a blackbody radiation temperature of ∼ 3000 K (Wikipedia: Cosmic microwave background: Relationship to the Big Bang), and so would have looked white hot or maybe even blue hot to the human eye (see Wikipedia: Red heat).
Note the comoving radius of the observable universe is a true physical distance: i.e., one measurable at an instant in time with a ruler. But, in fact, we CANNOT measure it with a ruler. It is NOT a direct observable and its value can only be determined from a cosmological model.
The Copernican principle is the assumption that our view of observable universe is typical. Everyone (i.e., us humans and the aliens) from their observing stations should see the same observable universe when averaged on a large enough scale.
As for the cosmological principle:
The cosmological principle is the assumption that on a large enough scale the observable universe is homogeneous (same in all places) and isotropic (same in all directions). To explicate further, every cube of space in the observable universe at one instant in cosmic time of large enough size scale (e.g., side length) should have the same average properties (e.g., same density, same distribution of galaxy properties, etc.).
Further explication of the cosmological principle:
On size scales less Yadav scale = 370/h_70 Mpc, there are variations in the number and behavior of galaxies, galaxy clusters, galaxy superclusters, and other large scale structures. So cubes of side length ⪅ 370/h_70 Mpc do NOT have the same average properties. They have a range of properties and the cosmological principle does NOT apply to them.
To further explicate the observable universe, consider the 2 artist's conceptions of it in the figure below (local link / general link: observable_universe_cartoon.html).
General Caption: Image 1: A diagram of the observable universe. Image 2: A cartoon observable universe embedded in a much larger surrounding outer universe.
Images:
However, the farther you look out, the further back in cosmic time you look because of the finite vacuum light speed c = 2.99792458*10**5 km/s ≅ 3*10**5 km/s. So we see the observable universe as it looked further in the past, the farther out we look. Astronomers have this great advantage over historians: we can literally see the past.
For all larger astronomical distance scales, see Cosmology file: astronomical_distances_larger.html.
Since Hubble constant value changes a bit with every new measurement, it is convenient to write H_length in terms of the reduced Hubble constant h_70 = H_0/(70 (km/s)/Mpc) as we have done above.
The favored Hubble constant value circa 2024 is 67.4(5) (see Wikipedia: Λ-CDM model parameters). Revisions by a few percent are possible.
There is no reason to believe the particle horizon defines the boundary of the whole universe---we don't have to follow Aristotle (384--322 BCE) anymore.
So the observable universe is very probably embedded in a much larger universe which is much the same as the observable universe for a long way. This probability is because the observable universe shows no signs of a boundary and has homogeneity and isotropy: i.e., it obeys the cosmological principle.
However, well beyond the particle horizon according to the eternal inflation paradigm, there could be a boundary between our pocket universe and a false-vacuum background universe with other pocket universes.
Image 1 Caption: A pie chart showing the calculated amounts of mass-energy in the observable universe. Beyond the observable universe, we have speculative theories, but which if any are correct, we do NOT know.
Features:
Actually, people often now use mass, energy, and mass-energy as synonyms. They use whatever terms seems most suitable for the context. Mass-energy tends to be used when the mass-energy equivalence is being emphasized---or they are just being verbose. Note:
Only 0.4 % is of the mass-energy of the observable universe is stellar matter---which is baryonic matter which is NOT baryonic dark matter.
The fact that stellar matter makes up so little of the mass-energy of observable universe is quite a change from circa the 1970s when some folks maintained that it was still possible to hypothesize that it was all of mass-energy by discounting the still controversial evidence for dark matter.
The baryonic dark matter is, as aforesaid, mostly intergalactic medium (IGM) (which is intergalactic gas). The IGM has very low density, but there is a lot of space between galaxies, and so a lot mass in the IGM. Much of the IGM warm-hot intergalactic medium (WHIM)). WHIM is nearly invisible since it only radiates a little in the X-ray. Since the 2010s, we do have had significant observations of WHIM.
To account for the structure (including motions) of galaxies, galaxy groups, galaxy clusters, galaxy superclusters, we need far more mass-energy than is seen in stellar matter and this extra mass-energy is far more than allowed by the highly successful theory of Big Bang nucleosynthesis.
Hence there must be dark matter.
What are theories for what for dark matter and its theoretical replacement?
The dark matter particles just fly around as a nearly pressureless gas.
The dark matter clumped into dark matter halos under self-gravity and the dark matter halo gravity pulled baryonic matter into the dark matter halos, and so initiated the formation of the large-scale structure of the universe in the reionization era (AKA cosmic dawn: cosmic time ∼ 0.150--1 Gyr, z∈∼[6,20]).
In gravitationally-bound systems, the dark matter particles must individually follow chaotic orbits and NOT move as clumps of matter the way an ordinary gas with pressure would.
In fact, there is some hope that the dark matter particle will be discovered in circa the 2020s---but hopes have been dashed before.
The PBHs act just like the just described dark matter particles in cosmic evolution.
For more on PBHs as dark matter, see Black hole file: black_hole_primordial.html.
There is no consensus theory of what it is.
We see an effect, acceleration of the universe (i.e., the observed acceleration of the expansion of the universe), and define dark energy as the cause.
The simplest dark energy is the cosmological constant Λ (pronounced Lambda) which is NOT really an energy at all, but a modification of gravity in general relativity. It is the simplest of all modifications to general relativity to get the effect of acceleration of the universe, and so is favored by Occam's razor over other modifications. In fact, astronomers often just say Lambda as synonym for dark energy.
The cosmological constant Λ is the origin of the Λ in the name Λ-CDM model.
However, dark energy may be a real form of energy. The simplest theory is that it acts just like the cosmological constant Λ in causing the acceleration of the universe, but quantum field theorists think a real dark energy should have other properties.
Such properties could include nonconstancy in cosmic time and space and interactions with other forms of mass-energy other than gravity.
However, there is NO consensus theory of what the nonsimplest dark energy should be like.
Hopefully, new observations circa the 2020s will elucidate the dark energy.
To recapitulate, there is the large-scale structure which includes galaxies, galaxy groups (see the figure of Seyfert's Sextet above: local link / general link: seyfert_sextet.html), galaxy clusters, galaxy superclusters, galaxy filaments, galaxy walls, voids, and whole lot more.
In this section, we will discuss all the aforesaid features from a largely observational point of view: i.e., what is there to see.
In section Large-Scale Structure Formation and Evolution, we will discuss structure formation (i.e., the formation and evolution of the large scale structure of the observable universe).
Galaxy groups and galaxy clusters are probably mostly gravitationally bound: i.e., they will NOT expand with the expansion of the universe. On the other hand, galaxy superclusters though gravitationally interacting are probably mostly NOT gravitationally bound. In most cases, most of their component galaxy groups and clusters and field galaxies will move apart forever with the expansion of the universe---provided the Λ-CDM model or some other forever expanding cosmological models is true.
Note velocity dispersion (σ) is a sort of average of the absolute values of the velocities of a set of astro-bodies (relative to their mutual center of mass) forming a gravitationally-bound system. The kinetic energy of the astro-bodies holds them up from collapse to the center of mass under their own self-gravity.
The structure just above galaxies themselves are galaxy groups.
Characteristics of galaxy groups (see Wikipedia: Galaxy group: Characteristics):
Our own Milky Way belongs to a galaxy group with the inspiring name of the Local Group.
The Local Group is a very poor galaxy group: it has only 3 large galaxies.
A map of the Local Group is shown in the figure below (local link / general link: local_group.html).
Caption: The Local Group of Galaxies shown with 1 megalight-year (Mly) = 0.306601393 ... Mpc linear scale.
The radius of the largest circle is ∼ 5 Mly ≅ 1.5 Mpc.
Features:
The 3 large galaxies are visible to the naked eye: Milky Way is, of course, the milky band on the sky and the other two just look like cloudy stars (i.e., nebulae in the historical sense: historical nebulae).
Of the dwarf galaxies, yours truly thinks only the Magellanic Clouds are naked eye astronomical objects, and of course, they are invisible circumpolar objects relative to mid northern latitudes since they are sufficiently far south on the southern celestial hemisphere. They look like unconnected bits of the Milky Way to the naked eye (see Wikipedia: Magellanic Clouds: Characteristics). For the appearance of the Magellanic Clouds on the sky, see the figure below (local link / general link: milky_way_magellanic_clouds.html).
Caption: The night sky with the Milky Way and the Magellanic Clouds (Large Magellanic Cloud (LMC) closer to the horizon and Small Magellanic Cloud (SMC) farther from the horizon) which are small irregular galaxies in orbit around the Milky Way.
The image is from the site of Very Large Telescope (VLT), Paranal Observatory on Cerro Paranal in the Atacama Desert in northern Chile.
The image may be high-sensitivity since yours truly suspects the Milky Way with its dust lanes may NOT look this bright to the naked eye.
Credit/Permission: ©
ESO,
Yuri Beletsky,
2011
(uploaded to
Wikimedia Commons
by User:Jmencisom,
2011) /
CC BY-SA 3.0.
Image link: Wikimedia Commons:
File:Panoramic Large and Small Magellanic Clouds.jpg.
Local file: local link: milky_way_magellanic_clouds.html.
File: Galaxies file:
milky_way_magellanic_clouds.html.
Answer 1 is right.
Talk about gifts.
1 pc = 206264.806... astronomical units (AU) = (3.08567758...)*10**16 m = 3.26156377... light-years (ly) ≅ 3.26 ly.
Therefore HCG 87 is about 400 Mly away.
The points are part of the diffraction patterns of the brighest stars. They show up because of strong overexposure. The brightest stars are much brighter than the other astronomical objects in the image.
There are 4 points for each diffraction pattern because the CCD camera is held in front of the primary mirror by 4 arms. The 4 arms give a 4-fold symmetry that communicates itself to the diffraction patterns.
Galaxies are actually faint by comparison to bright foreground stars. So to image the galaxies well, you ineluctably overexpose the bright foreground stars.
In enhanced true-color images, the spiral arms are a complex mix of blue (from hot young OB stars), pink (from H II regions emitting the atomic hydrogen line Hα), and brown/black (from obscuration by interstellar dust).
Some images though are clearly false color.
The galactic halos of spirals are faint and often have populations of globular clusters.
Seen face-on or obliquely, spirals are easily recognized.
Seen edge-on, they can still be easily recognized from the colors of the spiral arms even if the spiral arms CANNOT be seen as spirals themselves.
The are just spherical or elliptical blobs that in true color are almost always just yellow with the brightness increasing toward the center.
Ellipticals have little interstellar dust and little star formation in the modern observable universe.
This accounts for their yellow color. They have NO or very few blue hot young OB stars and contain mainly older older Population I stars and Population II stars which, as aforesaid, are yellow to red in color.
Actually, there are NO ellipticals in HCG 87, but lenticular (S0) galaxies (like HGC 87b) look a lot like ellipticals since they have no spiral arms. HGC 87b, in particular, looks like an elliptical to casual inspection, and so can represent ellipticals.
For spiral galaxies, we can infer to some degree there appearance from other orientations because their galaxy types can be recognized independent of orientation.
For elliptical galaxies, situation is a bit harder because their 3-dimensional shapes CANNOT easily be inferred from their 2-dimensional projections on the sky.
Yours truly thinks of galaxies as constituting a giant mobile in space---but one we can only see from point of view---our Earth.
The structure just above galaxy group is galaxy cluster.
The basic characteristics of galaxy clusters (see Wikipedia: Galaxy Cluster: Basic properties and Wikipedia: Galaxy Cluster: Composition):
Galaxy clusters are also divided into REGULAR CLUSTERS which are roughly spherically symmetric with a concentration of galaxies in the center and IRREGULAR CLUSTERS which are irregular (FK-593).
As usual, there is actually a continuum between the types of galaxy clusters.
Also since the specifications are a bit vague, which category a galaxy cluster falls into will vary a bit with reference.
For an example of a RICH galaxy cluster, see the Coma Cluster in the figure below (local link / general link: galaxy_cluster_coma.html).
General Caption: Images of the galaxy cluster the Coma Cluster in constellation Coma Berenices.
Features:
Its velocity dispersion (σ) ∼ 1000 km/s. Its size scale is ∼ 14 Mpc.????
The elliptical galaxies NGC 4889 and NGC 4874 from the mosaic above can be located.
NGC stands for New General Catalogue (NGC) and IC for Index Catalogue (IC).
How many? Someone must have good statistics, but NOT yours truly. However, within 5 Mpc of the Milky Way ∼ 80 % of galaxies are in galaxy groups and clusters (see Wikipedia: Field galaxies).
POOR galaxy clusters far outnumber rich ones (FK-592) and most galaxies are NOT in rich clusters????.
Galaxies NOT in galaxy groups and clusters (i.e., isolated galaxies) are called field galaxies.
Also galaxy groups and galaxy clusters have NO sharp edges.
This last comment applies both to the galaxies in the galaxy clusters and the dark matter which makes most of their mass.
Both answers are right, but answer 1 is a more complete answer.
Of course, complex interactions among objects in a gravitationally bound system may impart sufficient kinetic energy to individual objects to allow them to escape. In fact, on a long enough time-scale a chaotic gravitationally bound system will gradually disperse completely: objects chaotically gain enough kinetic energy to escape, leaving the others more tightly bound, but always with enough kinetic energy to allow more escapes until all that is left is a 2-body system which in Newtonian physics if completely isolated is eternally stable and repeating clockwork. There may be rarely eternally stable stable n-body systems in Newtonian physics. The tendency of gravitationally bound multi-body systems to continuous escapes can be called "gravitational-system evaporation"
Gravitational perturbations from outside gravitationally bound multi-body systems can also lead to escape.
Now yours truly knows what you are thinking---"that's in Virgo"---well it straddles the line between the constellations Virgo and Coma Berenices.
A sky map of constellation Virgo (with the Virgo Cluster shown) is shown in the figure below (local link / general link: iau_virgo.html).
Caption: Constellation Virgo (The Virgin) (zodiac symbol ♍) on a sky map of a portion of the celestial sphere.
Features:
Thus, all point astronomical objects can be uniquely located by constellation: e.g., point astronomical object X is in Virgo.
Of course, extended astronomical objects can straddle multiple constellations.
Note Coma Berenices (Berenice's Hair) is the only IAU designated constellation named for an actual historical person or at least their hair: Queen Berenice II of Egypt (267/266--221 BCE), an ancestress of Cleopatra (69--30 BCE).
Caption: The observable universe out to proper distance radius ∼ 30 Mpc = 0.03 Gpc (∼ 0.2 % of the observable universe radius = 14.3 Gpc) from the center at the unlabeled Milky Way: i.e., to cosmological redshift z ≅ 0.007 and lookback time ∼ 0.1 Gyr.
This map includes the Virgo Supercluster (unlabeled) which is roughly centered on the Virgo Cluster and Local Group.
Credit/Permission: ©
Richard Powell,
circa or before 2008 /
Creative Commons
CC BY-SA 2.5.
Image link: Wikipedia:
File:Virgosupercluster atlasoftheuniverse.gif.
File: Cosmology file:
large_scale_structure_030_mpc.html.
Image 1 Caption: "This deep image (i.e., very long-exposure image) of the Virgo Cluster (obtained by Chris Mihos and his colleagues using the Burrell Schmidt Telescope) shows the diffuse light between the galaxies belonging to the galaxy cluster. North is up, east to the left. The dark spots indicate where bright foreground stars were removed from the Image 1. (i.e., they are masked out). The cD galaxy (AKA supergiant elliptical galaxy) M87 (NGC 4486) is the largest galaxy in the picture (lower left)." (Slightly edited.)
Features:
It is the nearest RICH galaxy cluster.
Image 2 Caption: Image 2 is of almost the same part of the Virgo Cluster as shown in Image 1 above.
The Image 2 creators have NOT masked out the bright foreqround stars, but have made the image in such a way that they are NOT glaring. They still appear as pointy stars if you click on the image and look closely.
Image 2 may be approximately true color, but it does NOT seem to have the blue of the spiral galaxies enhanced to be obvious.
Galaxy clusters can themselves be part of superclusters that can contain tens of galaxy clusters and have a size scale of 50 Mpc (FK-594). Yours truly believes they are all irregular in shape.???
Superclusters although gravitationally interacting appear to be mostly NOT gravitationally bound (FK-594). In most cases, most of their component galaxy groups and clusters and field galaxies will move apart forever with the expansion of the universe.
We take up the expansion of the universe in IAL 30: Cosmology.
The Local Group belongs to the Virgo Supercluster which itself is part of the Laniakea Supercluster.
Just judging by the name answer 3.
This is right. The center of mass is near the Virgo Cluster (Wikipedia: Virgo Supercluster: Galaxy distribution).
The Virgo Supercluster, Laniakea Supercluster (sans name), and the local large-scale structure of the universe, is shown in the figure below (local link / general link: large_scale_structure_z_0x035.html).
Image 1 Caption: A map of the large-scale structure of the universe of the local universe out to ∼ 150 Mpc = 0.15 Gpc (∼ 1 % of the observable universe radius = 14.3 Gpc) from the center at the unlabeled Milky Way: i.e., to cosmological redshift z ≅ 0.035 and lookback time ≅ 0.5 Gyr.
Features:
The model used is Λ-CDM model which has been the standard model of cosmology (SMC, Λ-CDM model) since circa 1998. However, it may need revision or replacement. See /big_bang_cosmology_limitations.html.
The web-like nature of the large-scale structure of the universe is somewhat apparent---hence the modern name for the actual existing (as opposed to just hypothetical) large-scale structure of the observable universe the cosmic web.
Yours truly thinks it's more like "cosmic foam".
Features of the Laniakea Supercluster:
Superimposed on the recession velocities of galaxies due to the expansion of the universe are peculiar velocities.
One can define a closed surface in space, where the peculiar velocities go to zero. Going outward from the closed surface the peculiar velocities point outward; going inward, they point inward.
The closed surface is analogous to the watershed for internal drainage basin.
Laniakea is defined by a closed surface such as which we have just specified (see, e.g., Tempel 2014). Alas, applying the specification of the closed surface requires vast amounts of accurate/precise data which so far is only available for Laniakea itself. In fact, there may NEVER be another Laniakea-like-defined supercluster or at least none so accurately defined as Laniakea itself. There also may NOT be so much importance in defining superclusters the rule used for Laniakea.
The scale size in the Image 1 and Image 2 are, in fact, large enough for the cosmological principle to apply. For the cosmological principle and the Yadav scale = 370/h_70 Mpc, see the insert below or (if not seen here) at local link / general link: cosmological_principle_scale.html: Cosmological Principle and its Size Scale.
The cosmological principle is the assumption that on a large enough scale the observable universe is homogeneous (same in all places) and isotropic (same in all directions). To explicate further, every cube of space in the observable universe at one instant in cosmic time of large enough size scale (e.g., side length) should have the same average properties (e.g., same density, same distribution of galaxy properties, etc.).
Further explication of the cosmological principle:
On size scales less Yadav scale = 370/h_70 Mpc, there are variations in the number and behavior of galaxies, galaxy clusters, galaxy superclusters, and other large scale structures. So cubes of side length ⪅ 370/h_70 Mpc do NOT have the same average properties. They have a range of properties and the cosmological principle does NOT apply to them.
Galaxies and larger groupings collectively are called the large-scale structure of the universe.
The larger structures include galaxy groups, galaxy clusters, galaxy superclusters, galaxy filaments (string-like bands of galaxies and larger groupings), galaxy walls (walls of galaxies and larger groupings), and (cosmic) voids (low density of galaxies). Collectively, galaxies and these larger structures are often referred to as the cosmic web which is essentially a descriptive synonym for the actual existing (as opposed to a just hypothetical) large-scale structure of the observable universe.
The voids are roughly spherical and have diameters of 10 to 100 Mpc (Wikipedia: voids). The voids are NOT empty, but just have a lower density of hydrogen gas and galaxies than elsewhere in the large-scale structure of the universe. In fact, they are the "gaps" in the cosmic web.
The study of the large-scale structure is actually considered part of cosmology.
The 3-dimensional appearance of the large-scale structure of the universe is foamy (FK-596; CK-396). However, the modern tendancy is to think of it as web-like and hence the modern name for the large-scale structure the cosmic web.
The local large-scale structure or cosmic web is illustrated in four figures below:
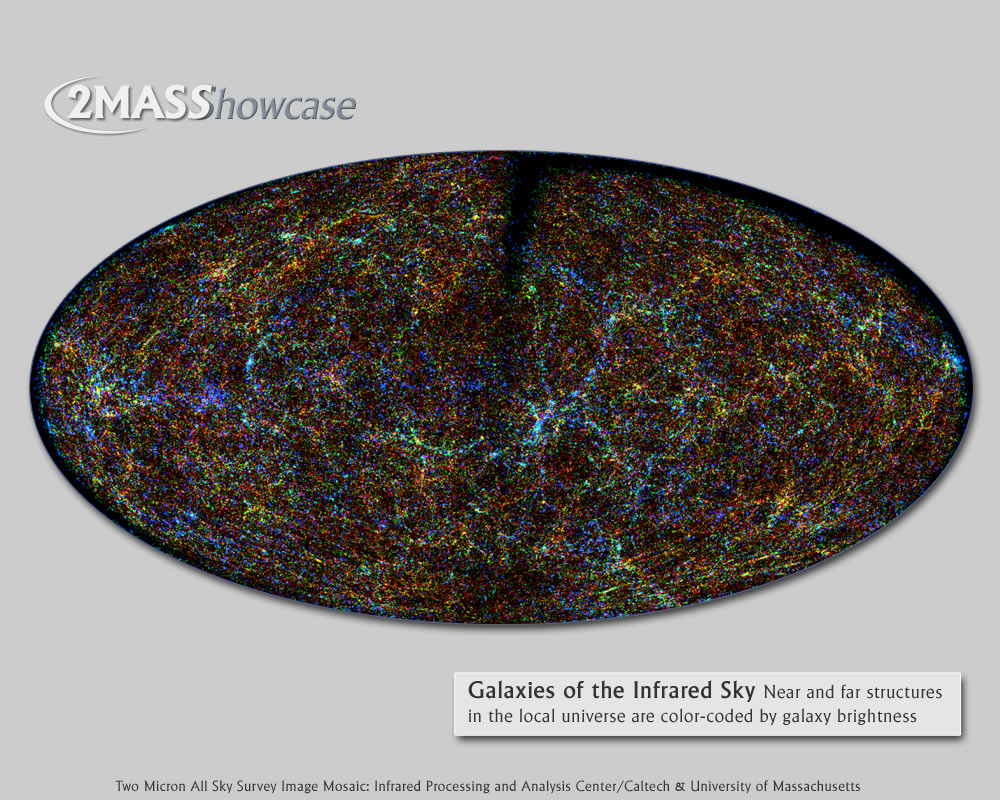
Caption: All sky galaxy map at 2.2 microns.
This map shows about 1.6 million galaxies in the nearby universe detected at 2.2 microns in the near infrared.
The image is in Hammer projection (2:1 axis ratio with the long axis corresponding to the equator or equator-like line), yours truly suspects. This maps a spherical surface into an 2:1 ellipse. The shapes of regions are distorted, but their areas are accurate in some fastion.
The brightest galaxies are in blue and thus are mostly nearby.
Faintest galaxies are in red, and thus are mostly relatively far away.
Green and yellow are somewhere in between, but the official caption is NOT specific.
The color scheme thus gives representation of the 3-dimensional large-scale structure.
The filaments, voids, and foamy nature of the large-scale structure of the universe are made somewhat visible in the image.
The untrained eye finds galaxy clusters, but superclusters of galaxies are harder to recognize.
There is a dark band that mostly lies on the edge of this image with a spur at the top center. This the band where Milky Way disk of star and dust blocks our view. The dark band is just an omission of sources.
Credit/Permission:
2MASS/T. H. Jarrett,
J. Carpenter, & R. Hurt,
University of Massachusetts,
Infrared Processing and Analysis
Center/Caltech,
NASA,
NSF,
before or circa 2004 /
Public domain.
Acknowledgment:
"Atlas Image [or Atlas Image mosaic] obtained as part of the Two Micron All Sky Survey (2MASS),
a joint project of the University of Massachusetts and
the Infrared Processing and Analysis Center/California Institute of Technology,
funded by the National Aeronautics and Space Administration and the National Science Foundation.
This is the stated policy of 2MASS."
Download site: Wikimedia Commons:
File:Galaxies of the Infrared Sky .jpg.
Image link: Itself.
Caption: "Panoramic view of the entire near-infrared sky reveals the distribution of galaxies beyond the Milky Way. The image is derived from the 2MASS Extended Source Catalog (XSC) (more than 1.5 million galaxies) and the Point Source Catalog (PSC) (nearly 0.5 billion Milky Way stars). The galaxies are color coded by cosmological redshift z obtained from UGC, CfA Redshift Survey, Tully NBGC, LCRS, 2dF Redshift Survey, 6dFGS, and SDSS (and from various observations compiled by the NASA/IPAC Extragalactic Database), or photo-metrically deduced from the K band (2.2 m). Blue are the nearest sources (z < 0.01), green are at moderate distances (0.01 < z < 0.04), and red are the most distant sources that 2MASS resolves (0.04 < z < 0.1). The map is projected with an equal area Aitoff projection (but Hammer projection (2:1 axis ratio with the long axis corresponding to the equator or equator-like line) seems to be meant) in the Galactic coordinate system (Milky Way at center)."
The image is in Hammer projection (2:1 axis ratio with the long axis corresponding to the equator or equator-like line), Hammer projection, yours truly suspects. This maps a spherical surface into an 2:1 ellipse. The shapes of regions are distorted, but their areas are accurate in some fashion.
The Milky Way obstructs the view of the large-scale structure of the universe in the image and in reality. The Milky Way can't be removed from the image without leaving some sort of artificial blank.
The filaments, voids, and foamy nature of the large-scale structure of the universe are made somewhat visible in image.
The cosmological redshifts or, for closest objects, distances in megaparsecs are given in parentheses for labeled galaxies, galaxy groups galaxy clusters, and galaxy superclusters.
For the local universe (i.e., z ≤ 0.5) cosmological physical distance approximately equals 4000*z. This follows from Hubble's law:
v=Hr , where v is recession velocity, r is cosmological physical distance, and H=70.4(1.4) (km/s)/Mpc is the Hubble constant (see Wikipedia: Concordance model: Parameters). One inverts to get r=v/H=zc/H≅4000*z , where we have used the approximate equality of recession velocity and redshift velocity (which is zc) for the local universe. The vacuum light speed c is exactly 2.99792458*10**5 km/s ≅ 3*10**5 km/s.
The Virgo Supercluster includes the Virgo Cluster. The Virgo Supercluster is, otherwise, NOT labeled on the image on think.
Credit/Permission:
NASA,
IPAC/Caltech,
Thomas Jarrett,
2004 /
Public domain.
Image link: Wikipedia:
File:2MASS_LSS_chart-NEW_Nasa.jpg.
Local file: local link: local_universe_ir.html.
File: Cosmology file:
local_universe_ir.html.
Caption: "Three-dimensional DTFE reconstruction of the inner parts of the 2dF Galaxy Redshift Survey. The figure reveals an impressive view on the cosmic structures in the local universe. Several galaxy superclusters stand out, such as the Sloan Great Wall, the largest structure in the observable universe known as of circa 2007." (Slightly edited.)
The image shows two slices through the sphere of the observable universe.
The dense regions of galaxies are represented by gray shading and the less dense regions or voids by white space.
The foamy, sudsy, filamentary nature of the large-scale structure is illustrated.
The Sloan Great Wall is about 300 Mpc away and is about 400 Mpc in length. These value indicate the size of the slices being shown.
Remember that the Hubble length = L_H = c/H_0 = 4.2827 Gpc/h_70 = 13.968 Gly/h_70, and so the Sloan Great Wall, although considered nearby, is still a fair fraction of a Hubble Length away.
Currently, H=70.4(1.4) (km/s)/Mpc is about the best determination of the Hubble constant (see Wikipedia: Concordance model: Parameters).
However, since the best Hubble constant value fluctuates with time, it is convenient to adopt 70 (km/s)/Mpc as a fiducial value and write quantities that depend on the Hubble constant in terms of h_70. Hubble constant itself written this way is H=70*h_70 (km/s)/Mpc.
Recall that the Hubble length = L_H = c/H_0 = 4.2827 Gpc/h_70 = 13.968 Gly/h_70, is a characteristic size scale for the observable universe within the expanding universe paradigm that is indepdent of specific models (e.g., the Λ-CDM model).
Note that the observable universe radius = 14.3 Gpc in the Λ-CDM model with about the best available parameters (see Wikipedia: Observable universe).
Credit/Permission: ©
Willem Schaap (AKA User:Wschaap),
2007
(uploaded to Wikipedia
by User:Zoe0,
2009) /
Creative Commons
CC BY-SA 3.0.
Image link: Wikipedia:
File:2dfdtfe.gif.
Image 1 Caption: A map of the large-scale structure of the universe of the local universe out to ∼ 150 Mpc = 0.15 Gpc (∼ 1 % of the observable universe radius = 14.3 Gpc) from the center at the unlabeled Milky Way: i.e., to cosmological redshift z ≅ 0.035 and lookback time ≅ 0.5 Gyr.
Features:
The model used is Λ-CDM model which has been the standard model of cosmology (SMC, Λ-CDM model) since circa 1998. However, it may need revision or replacement. See /big_bang_cosmology_limitations.html.
The web-like nature of the large-scale structure of the universe is somewhat apparent---hence the modern name for the actual existing (as opposed to just hypothetical) large-scale structure of the observable universe the cosmic web.
Yours truly thinks it's more like "cosmic foam".
Features of the Laniakea Supercluster:
Superimposed on the recession velocities of galaxies due to the expansion of the universe are peculiar velocities.
One can define a closed surface in space, where the peculiar velocities go to zero. Going outward from the closed surface the peculiar velocities point outward; going inward, they point inward.
The closed surface is analogous to the watershed for internal drainage basin.
Laniakea is defined by a closed surface such as which we have just specified (see, e.g., Tempel 2014). Alas, applying the specification of the closed surface requires vast amounts of accurate/precise data which so far is only available for Laniakea itself. In fact, there may NEVER be another Laniakea-like-defined supercluster or at least none so accurately defined as Laniakea itself. There also may NOT be so much importance in defining superclusters the rule used for Laniakea.
The scale size in the Image 1 and Image 2 are, in fact, large enough for the cosmological principle to apply. For the cosmological principle and the Yadav scale = 370/h_70 Mpc, see the insert below or (if not seen here) at local link / general link: cosmological_principle_scale.html: Cosmological Principle and its Size Scale.
Form groups of 2 or 3---NOT more---and tackle Homework 29 problems 2--5 on galaxies, large scale structure, and galaxy formation.
Discuss each problem and come to a group answer.
Let's work for 5 or so minutes.
The winners get chocolates.
See Solutions 29.
Credit/Permission: ©
User:4028mdk09,
2009 /
Creative Commons
CC BY-SA 3.0.
Image link: Wikipedia:
File:Becher Kakao mit Sahnehäubchen.JPG.
Local file: local link: chocolate_hot.html.
File: Art_c file:
chocolate_hot.html.
The cosmological principle is explicated in the figure below (local link / general link: cosmological_principle.html).
Caption: A diagram of the observable universe illustrating the cosmological principle.
For the a detailed explication of the cosmological principle, see the insert below or (if not seen here) at local link / general link: cosmological_principle_scale.html: Cosmological Principle and its Size Scale.
The cosmological principle is the assumption that on a large enough scale the observable universe is homogeneous (same in all places) and isotropic (same in all directions). To explicate further, every cube of space in the observable universe at one instant in cosmic time of large enough size scale (e.g., side length) should have the same average properties (e.g., same density, same distribution of galaxy properties, etc.).
Further explication of the cosmological principle:
On size scales less Yadav scale = 370/h_70 Mpc, there are variations in the number and behavior of galaxies, galaxy clusters, galaxy superclusters, and other large scale structures. So cubes of side length ⪅ 370/h_70 Mpc do NOT have the same average properties. They have a range of properties and the cosmological principle does NOT apply to them.
Caption: E.A. Milne (1896--1950) (see also E.A. Milne (1896--1950): Biography) was an important 20th century cosmologist.
E.A. Milne originated the term cosmological principle in 1935 (Cormac O'Raifeartaigh, et al., 2017, p. 29) though the concept goes back to Isaac Newton (1643--1727) in Principia (1687) and maybe earlier (Wikipedia: Cosmological principle: Origin). It is one of the most basic assumptions of modern cosmology. Albert Einstein (1879--1955) used the cosmological principle (as a vastly simplifying assumption without using the term) in formulating early general relativistic cosmology and in his Einstein universe (presented 1917).
Of course, E.A. Milne (1896--1950) and other early users of the cosmological principle did NOT have modern evidence for it. For them, it was a vastly simplifying assumption for research in cosmology.
It was once wondered if there was NO limit to structure---NO End of Greatness. That one would keep finding structure on larger scales.
To explicate, say galaxy superclusters were grouped into Type II superclusters which were grouped into type III superclusters which were ... and so on forever. There would be NO End of Greatness and the mean mass-energy of the universe would go to zero if there were no mass-energy between galaxies. This cosmological model was considered once and was called the hierachical world model (Bo-14--15,19).
A hierachical world model could even be a fractal.
A fractal is a thing that is or looks the same on all or many scales at least in some approximation. The branches and roots of trees are approximate fractals.
For example, one can make a fractal by drawing an iteration of 3 branches from each branch.
The animation in the figure below (local link / general link: fractal_koch_snowflake.html) illustrates the construction of a fractal.
But the observable universe is NOT a fractal nor any other kind of hierachical world model so far as we can tell.
Also, so far as we can tell the observable universe obeys the cosmological principle: i.e., the assumption that on a large enough distance scale the observable universe is homogeneous (same in all places) and isotropic (same in all directions).
But there is NO sharply-defined distance scale for the size of the largest structures. However, it is still useful to have a fiducial cosmological principle size scale and the Yadav scale = 370/h_70 Mpc (where reduced Hubble constant h_70=H_0/(70 km/s/Mpc)) can be adopted. It has some theoretical justification (Wikipedia: Cosmological principle: Violations of homogeneity).
For further explication of the cosmological principle, see Cosmology file: cosmological_principle.html.
Caption: "The 7 first steps of the building of the Koch snowflake in a gif animation. Notice the parallel corresponding diameters present in the inner rhomboids--yes, just notice that." (Somewhat edited.)
The Koch snowflake is a fractal.
In this animation, we see the fractal structure being built up as the surface becomes more and more corrugated.
A fractal is an geometric object that shows self-similarity. It looks the same on every scale ideally.
Many structures in nature are fractal over some range of scales to some approximation---like the coastline of Norway.
Credit/Permission:
Antonio Miguel de Campos (AKA User:To campos),
2007 /
Public domain.
Image link: Wikipedia:
File:Von Koch curve.gif.
Local file: local link: fractal_koch_snowflake.html.
File: Mathematics file:
fractal_koch_snowflake.html.
This section is for student reading only. It is best to discuss structure formation (i.e., the formation of the large scale structure of the observable universe or cosmic web) while explicating illustrative videos, and so we skip on to subsection Structure Formation in Videos below.
So see the outline in the figure below (local link / general link: large_scale_structure_formation_outline.html).
The galaxies themselves became organized in the large-scale structure: the cosmic web consisting of galaxy walls, galaxy filaments, galaxy clusters, galaxy groups, and voids.
For an example galaxy cluster, see the figure below (local link / general link: galaxy_cluster_RXC_J0142.9+4438.html).
Caption: "Galaxies abound in this spectacular Hubble Space Telescope (HST, 1990--2040?) image; spiral galaxies (that is their spiral arms) swirl in all colours and orientations and fuzzy elliptical galaxies can be seen speckled across the frame as softly glowing smudges on the sky. Each visible speck of a galaxy is home to countless stars A few stars closer to home shine brightly in the foreground (i.e., foreground stars in the Milky Way showing diffraction pattern points from overexposure because they are bright compared to every else in the image), while a massive galaxy cluster (catchily named RXC J0142.9+4438, AKA CIZA J0142.9+4438) nestles at the very centre of the image; an immense collection of maybe thousands of galaxies, all held together by the relentless force of gravity.
Galaxy clusters are some of the most interesting astronomical objects in the observable universe. They are the nodes of the cosmic web which is a more descriptive term for the large-scale structure of the universe. To study them is to study the organisation of matter on the grandest of scales. Not only are galaxy clusters ideal subjects for the study of dark matter and dark energy, but they also allow the study of farther-flung galaxies. Their immense gravitation means they distort the spacetime around them, causing them to act like giant gravitational lenses. The light of background galaxies is warped and magnified as it passes through or around the galaxy cluster, allowing astronomers insight into the distant and therefore late early universe (i.e., Dark Ages and large-scale structure emergence era, cosmic time ∼ 370 kyr--1 Gyr). This image was taken by the Hubble Space Telescope's (HST, 1990--2040?) Advanced Camera for Surveys (2002--) and Wide-Field Camera 3 (2009--) as part of an observing programme called RELICS (Reionization Lensing Cluster Survey). RELICS imaged 41 massive galaxy clusters with the aim of finding the brightest distant galaxies for the James Webb Space Telescope (JWST, 2021--2041?) to study."
(Somewhat edited.)
Credit/Permission:
ESA,
NASA,
Hubble Space Telescope (HST),
RELICS (Reionization Lensing Cluster Survey),
(uploaded to Wikimedia Commons
2018
by User:Jmencisom,
2018) /
CC BY-SA 4.0.
Image link: Wikimedia Commons:
File:Galactic treasure chest RXC J0142.9+4438.jpg.
Local file: local link: galaxy_cluster_RXC_J0142_9_4438.html.
File: Galaxies file:
galaxy_cluster_RXC_J0142_9_4438.html.
The rich got richer and the poor got poorer.
In the dense initial density fluctuations, there were gravitational runaways of matter (∼ 85 % of it being dark matter) to form clumps (dense regions) called dark matter halos where the proto galaxies formed.
In the less-dense initial density fluctuations, the dark matter did NOT clump and large voids formed.
The baryonic matter to 1st order just follows the dark matter pulled along by the dark matter's gravity.
"Cold" in this context means moving slow relative to the vacuum light speed c = 2.99792458*10**5 km/s ≅ 3*10**5 km/s: i.e., at nonrelativistic velocities relative to the local comoving frames.
Cold dark matter is needed to get the clumping properties needed for the observed large-scale structure.
Without cold dark matter, the baryonic matter would probably still clump to form stars, but galaxies and the rest of large-scale structure would look very different from what we see.
Note that there MAY be exotic hot dark matter (dark matter moving at relativistic velocities) and warm dark matter (at intermediate velocities), but these dark matter forms can only be of secondary importance in structure formation.
Actually, neutrinos forming the cosmic neutrino background (a relic of the Big Bang from before Big Bang nucleosynthesis (BBN)) were originally a form of hot dark matter, but they lost kinetic energy in a manner similar to that of cosmologically redshifting photons and became a minor contribution to cold dark matter.
Such N-body simulations in the context of the Λ-CDM model (AKA concordance model) (our best current cosmological model), have always done a good 1st order job in reproducing the statistical properties of the observed large-scale structure.
So to fully understand large-scale structure, we must understand how the baryonic matter clumps into observable galaxies, etc. This is much more complicated than just studying dark matter since baryonic matter interacts through pressure forces as well as gravity.
The pressure forces include ideal gas law pressure, radiation pressure, and magnetic pressure (which if nothing else helps to launch relativistic bipolar jets from central supermassive black hole, and thus provides AGN feedback to structure formation).
We are trying to calculate simulated large-scale structure that as the SAME statistical properties as that of the large-scale structure: e.g., same average number of galaxies of each type per unit volume, same average number of galaxy clusters per unit volume, etc.
Why CAN'T we calculate our observable universe?
The initial density fluctuations left from the Big Bang era CANNOT be known. We can only theorize their statistical properties, and so only calculate the statistical properties of the observable universe that evolves from them.
But we have a good theory of those fluctuations since we do calculate the statistical properties of the observable universe pretty well.
There is NO reason at present to believe that we will NOT eventually match the statistical properties of the observable universe to high accuracy provided we can the right overall cosmological model.
Do we have it now. Probably NOT, at least NOT exactly. See the next item.
There are some tensions for structure formation, but NO falsifications currently.
Digression on jargon: A falsification is a discrepancy between theory and observation sufficiently large that one judges the theory to be wrong.
A tension is a discrepancy that does NOT cause one to judge the theory as wrong. The discrepancy may be due uncertainties in the observations or in the application of the theory.
Tensions suggest there might be a problem with a theory, but more work is needed to show if that is true. More work hopefully will cause the tensions to go away OR turn them into falsifications. Either way, progress.
Caption: "A computer simulation shows one possible scenario for how light is spread through the early universe on vast scales (image more than 50 Mly across)." (Somewhat edited.)
The original caption does NOT give complete information, but the image is probably for z ≅ 2.5 which corresponds to lookback time ∼ 10 Gyr (i.e., cosmic time ∼ 4 Gyr). Recall in the Λ-CDM model the age of the observable universe = 13.797(23) Gyr (Planck 2018) (see Planck 2018: Age of the observable universe = 13.797(23) Gyr).
The image is in false color, but probably NOT so far off true color.
We do NOT see any individual galaxies in the image. We are seeing large-scale structure: i.e., the cosmic web consisting of galaxy walls, galaxy filaments, galaxy clusters, galaxy groups, and voids.
Credit/Permission: ©
Andrew Pontzen, Fabio Governato
2014
(uploaded to
Wikimedia Commons
by User:Uclmaps,
2014) /
CC BY-SA 2.0.
Reference: Constraints on ionising photon production
from the large-scale Lyman-alpha forest, 2014, but this image itself is NOT there.
Image link:
Wikimedia Commons:
File:Large-scale structure of light distribution in the universe.jpg.
Local file: local link: large_scale_structure_early_universe.html.
File: Cosmology file:
large_scale_structure_early_universe.html.
Structure formation (i.e., the formation of the large scale structure of the observable universe) is now discussed while explicating illustrative videos: first N-body simulation videos, second Large-Scale structure of the universe videos.
For the videos, see also videos below (local link / general link: large_scale_structure_videos.html) further dynamically illustrate the formation of large-scale structure.
M = sum_(k=1)^(N) (N-k) = N**2 - sum_(k=1)^(N) k = N**2 - N(N+1)/2 = N(N+1)/2(see Wikipedia: Summation: Powers and logarithm of arithmetic progressions). The number of calculations for N = 10 is thus M = 55, and NOT 81.
a(t) = 1/(z+1) .So the cosmic scale factor a(t) so varies from 1/16.43 at z = 15.43 to 1 at cosmic present = to the age of the observable universe = 13.797(23) Gyr (Planck 2018)).
UNDER RECONSTRUCTION BELOW, BUT CAN BE READ FOR RECAPITULATION
Structure formation (i.e., the formation and evolution of the large-scale structure of the universe) can only be done by computer simulations.
The 1st order calculations are N-body simulations which include only dark matter which makes up ∼ 26 % of the mass-energy of the observable universe and ∼ 85 % of the CLUMPABLE mass-energy
The dark energy makes up ∼ 70 % of the mass-energy of the observable universe, but it is thought NOT to clump.
The N-body simulations only use gravitational forces.
To go beyond the 1st order calculations, you need to include baryonic matter which is subject to gravitational forces, pressure forces, and magnetic force. There are also complex AGN feedback from central supermassive black holes.
Computer simulation with baryonic matter are an ongoing and rapidly improving research area. A lot of success has been achieved in modeling the observable universe, but there is still a long way to complete understanding.
?????
Computational simulations that start with a primordial distribution of density fluctuations and try to reproduce the modern large-scale structure are an ongoing enterprise with some success.
But such computations are demanding and involve many approximations including the treatment of the dark matter and dark energy which we discuss briefly below in the section Galaxy Formation.
The animation obtained from a computer simulation shown in the figure below (local link / general link: large_scale_structure_formation.html) dynamically illustrates the formation of large-scale structure.
Caption: An animation of a computer simulation illustratin structure formation: (i.e., formation of the large-scale structure of the universe) over cosmic time ∼ 0.27--13.797 Gyr (i.e., lookback time ∼ 13.53--0 Gyr, where 0 is cosmic present = to the age of the observable universe = 13.797(23) Gyr (Planck 2018)) with cosmic time represented by cosmological redshift z ∼ 15--0.
The rotation of the computer simulation cube is rather annoying, but it allows you to see in multiple directions. The animation is also a bit for fast for easy comprehension.
Features:
Dark matter makes up 84.5 % of all matter according to best modern measurements (see Wikipedia: Dark matter: Overview).
Dark matter forms gravitational wells in which the ordinary matter clumps and forms visible structures form.
The galaxies form in what are called dark matter halos.
So there NO stars or galaxies in the simulation.
But you can imagine where they are from the clumping of the bright simulation particles.
Regions that are initially denser have runaway growth pulling in dark matter.
Regions that initially less dense lose dark matter and become voids.
In other words, "The rich get richer and the poor get poorer."
And that's how the cosmic web forms.
This means that (cosmological) proper distance size (true physical size) of the box increases with cosmic time due to the expansion of the universe, but that growth is "divided" out of the animation.
But it really happens in simulation.
a(t)/a_0 = 1/(1+z) ,where a_0 = a(t=present) = 1 by convention.
Since z goes from 30 to 0, cosmic scale factor a(t) a(t) increases from 1/31 ≅ 0.032258 ... to 1 or by a factor of 31.
Thus, the underlying cosmological model is probably the Λ-CDM model which is favored modern cosmological model.
The age of the universe according to the Λ-CDM model is 13.8 Gyr, and so the simulation probably starts within 1 Gyr of the Big Bang.
Probably, the simulation is met to represent structure formation starting from primordial density fluctuations.
This suggests that they are doing many things correctly.
However, significant disagreements or tensions between simulations and observations exist.
These might removed by improvements in the realism of the simulations.
However, it may be that key ingredients are missing from the simulations or that the Λ-CDM model is NOT the correct cosmological model of the observable universe.
Hopefully, the simulations will improve and give us more answers about the observable universe and the universe as whole which may be the multiverse.
A major problem is the dark matter must have played major role in formation since it is overwhelmingly most of the mass. But that role is hard to determine exactly.
What the dark energy does is another rather open question.
Dark matter is matter we only notice through its gravitational effect and it seems to be overwhelmingly most of the matter of the observable universe.
About 20 % or so is baryonic dark matter. Most of this baryonic dark matter is hot and nearly invisible dilute hydrogen/helium gas between galaxies and galaxy clusters---the intergalactic medium which is mainly warm-hot intergalactic medium (WHIM)) and nearly-invisible intergalactic baryonic matter. Both these invisible matter types (which are mainly ionized hydrogen and helium with maybe a little enrichment of metals) radiate in the X-ray band, but with low detectability---we do observe it now a bit.
However, when we (and everyone else) says dark matter without qualification, we (and everyone else) mean NOT the baryonic dark matter but exotic dark matter.
The (exotic) dark matter may be some kind of very unreactive exotic particles that are spread through space, but clumped somehow in the dark matter halos of galaxies. People are trying to detect the exotic particles and there have been a few hints of detections, but nothing solid so far. On the other hand, the dark matter may be primordial black holes created in the Big Bang era before Big Bang nucleosynthesis (BBN).
Dark energy is an unknown energy that seems to be accelerating the expansion of the universe. Dark energy is discussed in IAL 30: Cosmology.
For the currently determined amounts of dark matter and dark energy (given that the Λ-CDM model is true), see the figure below (local link / general link: pie_chart_cosmic_energy.html).
Both the concepts of dark matter and dark energy may be greatly modified or even dispensed with if the relativistic MOND theory turns out to real to some degree or other (Bekenstein, J. D. 2004, An Alternative to the Dark Matter Paradigm: Relativistic MOND Gravitation, astro-ph/0412652). See IAL 25: Black Holes for more on the relativistic MOND theory.
Image 1 Caption: A pie chart showing the calculated amounts of mass-energy in the observable universe. Beyond the observable universe, we have speculative theories, but which if any are correct, we do NOT know.
Features:
Actually, people often now use mass, energy, and mass-energy as synonyms. They use whatever terms seems most suitable for the context. Mass-energy tends to be used when the mass-energy equivalence is being emphasized---or they are just being verbose. Note:
Only 0.4 % is of the mass-energy of the observable universe is stellar matter---which is baryonic matter which is NOT baryonic dark matter.
The fact that stellar matter makes up so little of the mass-energy of observable universe is quite a change from circa the 1970s when some folks maintained that it was still possible to hypothesize that it was all of mass-energy by discounting the still controversial evidence for dark matter.
The baryonic dark matter is, as aforesaid, mostly intergalactic medium (IGM) (which is intergalactic gas). The IGM has very low density, but there is a lot of space between galaxies, and so a lot mass in the IGM. Much of the IGM warm-hot intergalactic medium (WHIM)). WHIM is nearly invisible since it only radiates a little in the X-ray. Since the 2010s, we do have had significant observations of WHIM.
To account for the structure (including motions) of galaxies, galaxy groups, galaxy clusters, galaxy superclusters, we need far more mass-energy than is seen in stellar matter and this extra mass-energy is far more than allowed by the highly successful theory of Big Bang nucleosynthesis.
Hence there must be dark matter.
What are theories for what for dark matter and its theoretical replacement?
The dark matter particles just fly around as a nearly pressureless gas.
The dark matter clumped into dark matter halos under self-gravity and the dark matter halo gravity pulled baryonic matter into the dark matter halos, and so initiated the formation of the large-scale structure of the universe in the reionization era (AKA cosmic dawn: cosmic time ∼ 0.150--1 Gyr, z∈∼[6,20]).
In gravitationally-bound systems, the dark matter particles must individually follow chaotic orbits and NOT move as clumps of matter the way an ordinary gas with pressure would.
In fact, there is some hope that the dark matter particle will be discovered in circa the 2020s---but hopes have been dashed before.
The PBHs act just like the just described dark matter particles in cosmic evolution.
For more on PBHs as dark matter, see Black hole file: black_hole_primordial.html.
There is no consensus theory of what it is.
We see an effect, acceleration of the universe (i.e., the observed acceleration of the expansion of the universe), and define dark energy as the cause.
The simplest dark energy is the cosmological constant Λ (pronounced Lambda) which is NOT really an energy at all, but a modification of gravity in general relativity. It is the simplest of all modifications to general relativity to get the effect of acceleration of the universe, and so is favored by Occam's razor over other modifications. In fact, astronomers often just say Lambda as synonym for dark energy.
The cosmological constant Λ is the origin of the Λ in the name Λ-CDM model.
However, dark energy may be a real form of energy. The simplest theory is that it acts just like the cosmological constant Λ in causing the acceleration of the universe, but quantum field theorists think a real dark energy should have other properties.
Such properties could include nonconstancy in cosmic time and space and interactions with other forms of mass-energy other than gravity.
However, there is NO consensus theory of what the nonsimplest dark energy should be like.
Hopefully, new observations circa the 2020s will elucidate the dark energy.
We will only give a brief sketch of the current theory of galaxy formation: it is still a somewhat uncertain theory---and yours truly does NOT know as much as yours truly should know.
The Big Bang (see IAL 30: Cosmology) left fluctuations in the density of the early universe gas as we mentioned above in connection with the large-scale structure.
These fluctuations led to gravitational runaways to PROTOGALAXIES and these merged to make galaxies.
The galaxies formed from the "the bottom up": (i.e., from smaller objects) rather from "top down" (i.e., out of galaxy-sized clouds) as was once theorized.
These objects are NOT around in the modern universe, and so must have merged to make modern galaxies.
Caption: A Hubble tuning fork diagram illustrating the Hubble sequence which is a galaxy morphological classification scheme developed by Edwin Hubble (1889--1953) in 1926 (see Wikipedia: Hubble sequence).
The Hubble sequence is conventionally illustrated on a Hubble tuning fork diagram as shown here.
Hubble introduced the Hubble tuning fork diagram by 1936 at the latest (see The Realm of the Nebulae, Edwin Hubble, 1936, p.45; The Realm of the Nebulae, Edwin Hubble, 1936, p. 45, partially online; No-509).
Features:
But it's still highly useful to look at a galaxy and know with some degree of certainty what type of galaxy it is.
Confusingly, ellipticals and lenticulars are collectively referred to as early-type galaxies and spirals as late-type galaxies. Just accept this misleading terminology.
A galaxy merger disorders the orbital planes of the stars so that they are NO longer concentrated in a galactic disk, but form an approximate spheroid in many cases: i.e., the merging galaxies become an elliptical.
Ellipticals by the way are usually red sequence galaxies (AKA quenched galaxy) which means they have little or no star formation because their interstellar medium (ISM) is too hot for molecular cloud to form. For theories of galaxy quenching, see Wikipedia: Galaxy formation and evolution: Galaxy quenching.
It may be that SOME ellipticals formed when the early star formation was very fast and occurred before a disk of gas could form.
There is then no energy dissipation mechanism for stars which are point-like and super-rarely collide in a hard sense: gravitational interactions are common but these tend NOT to dissipate kinetic and gravitational potential energy to heat.
Thus, the streaming and dissipation mechanism that leads to disk formation for gas does NOT occur for stars.
Consequently, the stars in ellipticals stayed in a swarm.
However, very likely most ellipticals form by galaxy mergers. Maybe they almost all do.
The process of galaxy merger randomizes the orbits of the stars and often strips of the gas.
The stars go right through each other in galaxy collisions, but the gas runs into gas clumps and becomes physically separated and tends to be lost which tends to turn off star formation. Or the gas becomes too hot for star formation. Its pressure is too high.
For a galaxy collisions see the video When galaxies collide! | 1:36 in Galaxy videos below (local link / general link: galaxy_videos.html):
The merged galaxy (likely a new elliptical) tends to be quenched galaxy in modern astro-jargon.
Why do quenched galaxies NOT revive by inflow of new gas and gas cooling?
They probably do or did in the past in some cases.
But it seems that dequenching is rare.
The fact that a galaxy merger occurred probably means crowded ????
Also star formation is slowing down generally as the universe expands and there is less gas inflow from the intergalactic medium (IGM).
Ellipticals are more likely in regions of greater density of galaxies.
Ellipticals can also be made by the collisions of spirals which strip the gas and randomize the star orbits and strip away the interstellar medium (ISM).
in the figure below (local link / general link: galaxy_mice.html).
Caption: "The Advanced Camera for Surveys (ACS), the newest camera on NASA Hubble Space Telescope (HST), has captured a spectacular pair of galaxies engaged in a celestial dance of cat and mouse or, in this case, mouse and mouse. Located 290 million light-years (89 Mpc) away in the constellation Coma Berenices, the interacting galaxies have been nicknamed The Mice (AKA NGC 4676) because of the long tidal tails of stars and gas emanating from each galaxy. The pair will eventually merge into a single galaxy, probably an elliptical galaxy." (Slightly edited).
Features:
The Antennae Galaxies have much more obvious tidal tails.
But if two globular clusters collide the probability of stellar collisions is higher since globular clusters have very high density of stars. Yours truly does NOT know what that probability is.
But even if it is highish, stellar collisions are still negligible overall in interacting galaxies.
In the universe, to look far away is to look long ago.
See the figure below for further discussion of ellipticals, galaxy mergers, and galaxy quenching (the turning of star formation).
Caption: "This graphic shows the evolutionary sequence in the growth of massive elliptical galaxy (e.g., cD or giant elliptical galaxies) over 13 Gyr, as gleaned from space-based and ground-based telescopic observations. The growth of this class of galaxies is quickly driven by rapid star formation and galaxy mergers." (Slightly edited.)
The growth of massive ellipticals is called galactic cannibalism---they eat their own.
Actually, galaxy formation and evolution is NOT yet perfectly understood. In particular, the galaxy quenching (i.e., the turning off of star formation) is NOT well understood.
Some considerations on galaxy quenching:
Certainly, in the early early formation of large-scale structure circa 1 Gyr after the Big Bang, galaxy mergers also created spiral galaxies or galaxies that evolved to being spiral galaxies. But this process may have turned off or drastically slowed over cosmic time since then.
Electromagnetic radiation (EMR) from accretion disks from sufficiently large central supermassive black holes is thought to keep any ISM gas too hot and buoyant to cool, lose pressure support, and initiate star formation.
We now know that there is hot ISM gas in ellipticals. It just tends to rather invisible radiating in the X-ray band????.
There is, however, little interstellar dust in ellipticals. Without new star formation, interstellar dust is NOT much replenished since it is made from metals created and ejected from stars in strong stellar winds or when they go and supernova.
If a galaxy merger strips most interstellar dust and thereby stops star formation by removing the cooling and shielding effect of the interstellar dust, it may NOT be possible to replenish the interstellar dust sufficiently in the modern observable universe to restart star formation.
Such gas is probably shocked heated during collisions that stripped it from the parent galaxies (FK-596).
In both ellipticals and spirals the star formation rate probably peaked early on in the universe.
The adjacent cartoon illustrates this, but the cartoon simplifies things by ignoring that some spirals have merged to make ellipticals.
Well let's go into the stories with lots of simplifications and omissions to keep from turning our discussion into a book.
The "rich get richer, the poor get poorer".
Gravitational runaway led to dark matter halos where the dark matter where the density was high and voids where it was low.
The dark matter halos formed gravitational wells that attracted ordinary matter almost entirely the hydrogen and helium in a 3:1 ratio.
If star formation proceeded very rapidly in a dark matter halo due to some initial condition????, most of the gas is used up to form stars in a few early generations of stars leaving little for later generations of stars.
Also there was no time for the gas to relax to galactic disk which requires pressure interactions which stars do NOT have---they pinpricks that interact gravitationally virtually only.
If there are no interactions with other galaxies, the elliptical galaxy only ages through the aging of its stars.
As cosmic time passes, progressively the less massive stars end their main-sequence lifetimes and turn into white dwarfs.
The end of the main-sequence lifetime must inject some matter back into the interstellar medium (ISM), but evidently NOT enough to promote much new star formation.
Stars keep forming up to the present in cosmic time and far into the future.
The ISM has time to relax through pressure interactions into a galactic disk where almost all the star formation happens.
Usually there are spiral arms for reasons that we go into section spiral arms.
The result is a spiral galaxy.
These are, in fact, common.
Galaxy mergers are complex events that tend to strip ISM and randomize star orbits of merging spiral galaxies or merging spiral galaxies elliptical galaxies.
So one tends to end up with elliptical galaxies.
Merging elliptical galaxies just give larger elliptical galaxies.
Both calculations and empirical evidence show that mergers yield elliptical galaxies.
The more compact the galaxy cluster, the more galaxy mergers will occur. So NOT surprisingly that compact galaxy clusters tend to have a higher fraction of ellipticals than less compact galaxy clusters.
These are the cD or giant elliptical galaxies: e.g., M87 in the Virgo Cluster in Virgo.
The growth of massive ellipticals is called galactic cannibalism---they eat their own.
This growth is illustrated in the figure below.
Form groups of 2 or 3---NOT more---and tackle Homework 29 problems 2--8 on galaxies, large scale structure, and galaxy formation.
Discuss each problem and come to a group answer.
Let's work for 5 or so minutes.
The winners get chocolates.
See Solutions 29.
Credit/Permission: ©
User:4028mdk09,
2009 /
Creative Commons
CC BY-SA 3.0.
Image link: Wikipedia:
File:Becher Kakao mit Sahnehäubchen.JPG.
Local file: local link: chocolate_hot.html.
File: Art_c file:
chocolate_hot.html.