
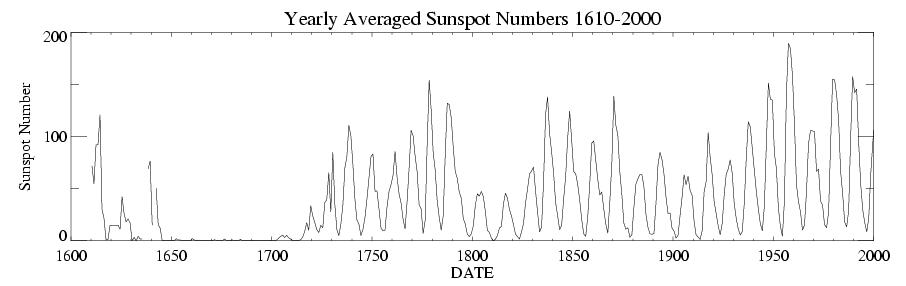
Image 1 Caption: "The graph shows the sunspot counts since the early telescopic era (1608--1700). Since c.1749, continuous monthly averages of sunspot activity have been available and are shown here as reported by the World Data Center Sunspot Index and Long-term Solar Observations at the Royal Observatory of Belgium, Brussels, Belgium. The numbers are based on an average of measurements from many different observatories around the world. Prior to c.1749, sporadic observations of sunspots are available. The data were compiled and placed on consistent monthly framework by Hoyt & Schatten (1998a) and Hoyt & Schatten (1998b).
The most prominent feature of the graph is the solar cycle (11 years on average; 9 to 14 year range) which is associated with the natural waxing and waning of solar activity. On longer time scales, the Sun has shown considerable variability, including the long Maunder Minimum (c.1645--1715) when almost NO sunspots were observed, the less severe Dalton Minimum (c.1790--1830), and the increased sunspot activity during the 20th century, known as the Modern Maximum (c.1914--2000). The causes for these variations are NOT well understood, but because sunspots and associated solar faculae affect the brightness (here = radiant flux or spectral flux) of the Sun, solar luminosity (average value L_☉ = 3.828*10**26 W) is lower during periods of low sunspot activity (i.e., during the solar minimum (solar luminosity ∼ 0.05 W ≅ 0.05 % below average)) and higher during periods of high sunspot activity (i.e., during the solar maximum (solar luminosity ∼ 0.05 W ≅ 0.05 % above average)). It is theorized that the low solar activity during the Maunder Minimum (c.1645--1715) may have been a secondary driver of the chilly Little Ice Age (c.1600--1850 or c.1350--1850 depending on definition). However this has been disputed and, in any case, Little Ice Age volcanism seems to have been the main driver (see Wikipedia: Little Ice Age: Solar activity; Wikipedia: Volcanic activity; Wikipedia: Little Ice Age volcanism)." (Somewhat edited.)
Note, the term Little Ice Age is an ill-defined. Some people use it for the period approixmately 1350--1850 and mean a period of constant climate shifts and NOT necessarily a cold spell (Fa-248--249).
The Solar Cycle and Sunspots:
-
Sunspots obey the
solar cycle (11 years on average;
9 to 14 year range).
Their frequency peaks during the solar maximum (solar luminosity ∼ 0.05 W ≅ 0.05 % above average) and troughs during the solar minimum (solar luminosity ∼ 0.05 W ≅ 0.05 % below average) (for solar maximum to solar minimum variation, see Wikipedia: Solar irradiance: Variation; NOAA: Climate.gov: Climate Change: Incoming Sunlight, 2009).
- Actually, the solar cycle
is a subcycle of the
Hale cycle (22 years on average)
which is cycle of reversals of the
north pole-south pole
polarity of the
solar magnetic field which is a
dipole magnetic field.
- At the start a solar cycle,
the sunspots are rare: there can even be
none: this is the solar minimum.
At mid-cycle there are typically of order 100 and the record was 254 as of c.2002 (HI-299): this is the solar maximum.
Note, the two 11-year phases of the Hale cycle (22 years on average) look identical to a person just counting sunspots and their locations (HI-299--300). Only when the magnetic fields are being measured is there a distinction: i.e., the reversals of the north pole-south pole polarity of the solar magnetic field and the tendency to reversal of the sunspot pair north pole-south pole polarity (see below).
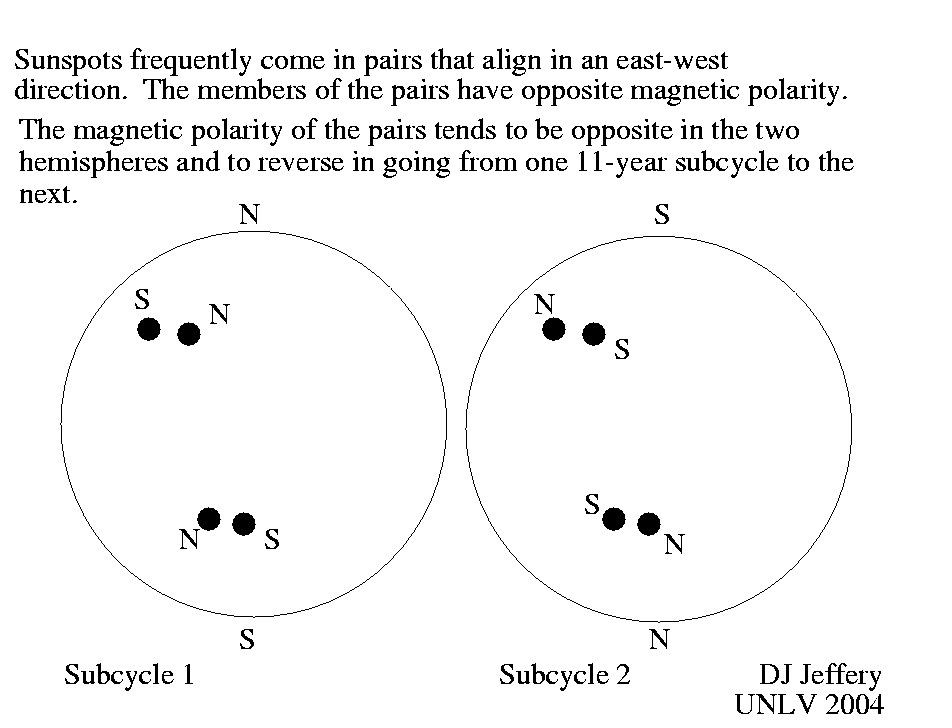
- Image 2 Caption: As well as the reversals of the north pole-south pole polarity of the solar magnetic field between the two 11-year phases (on average) of the Hale cycle (22 years on average), there also tend to be reversals of polarity of sunspot pairs. To be exact, in the hemisphere of the overall north pole, the north pole of pair leads in the solar rotation eastward and the south pole of the pair trails. In the hemisphere of the overall south pole, it is the opposite. When there is a overall polarity reversal of the solar magnetic field Sun's polarity, you get the change illustrated in Image 2.
- At the start of a solar cycle sunspots first appear at about 35° north and south latitude. As the solar cycle progresses, they move closer to the solar equator and at the end they are usually within 5° of the solar equator.
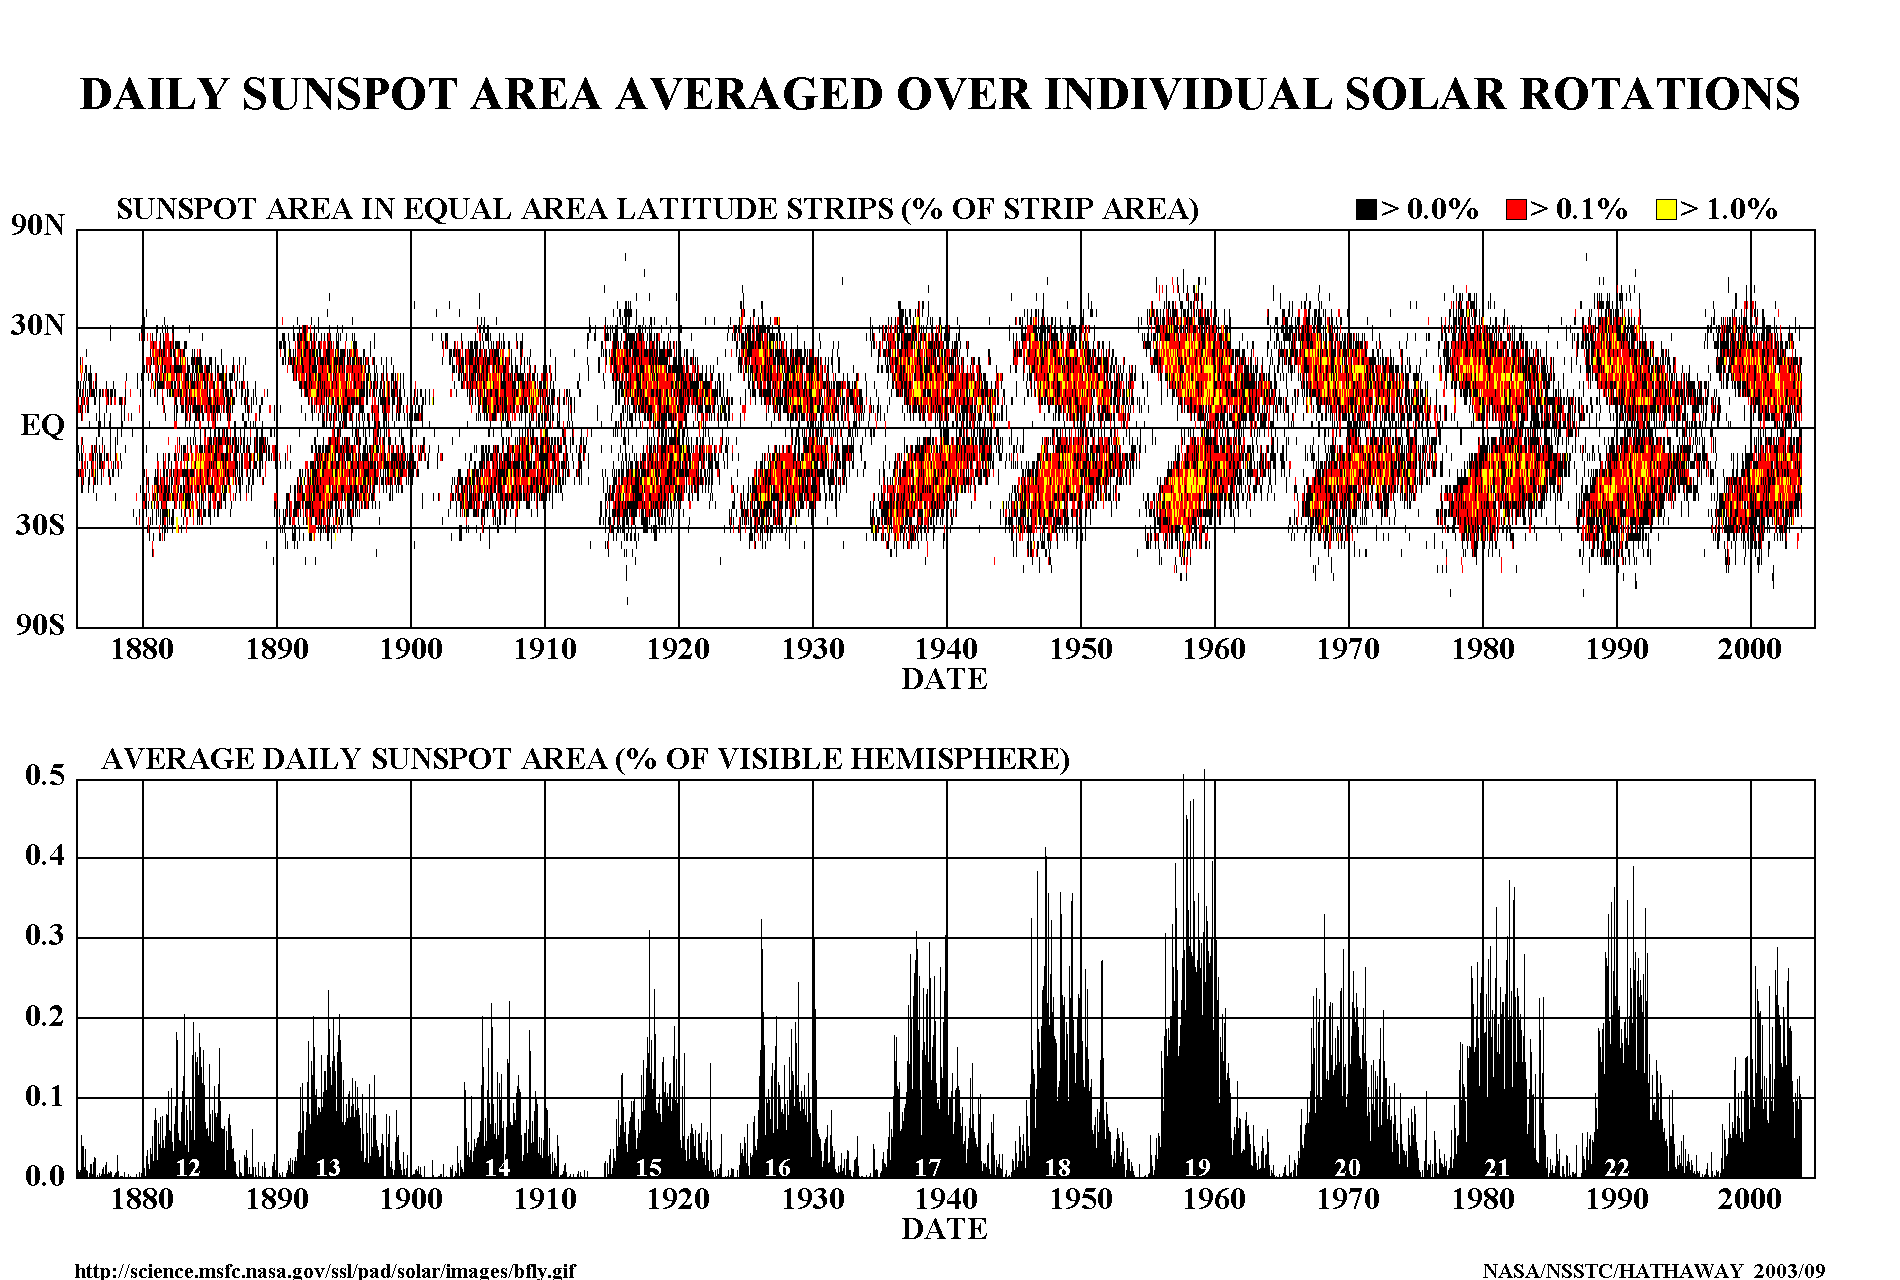
- Image 3 Caption: The latitude evolution of the sunspot distribution as a function of time over many solar cycles is illustrated by the butterfly diagram in Image 3. The shape of the pattern in a butterfly diagram gives rise to the name: it looks like a pair of butterfly wings.
- There are theories of sunspot formation (see Wikipedia: Sunspot: Formation; Wikipedia: Solar cycle: Solar dynamo). But we won't discuss them here.
In fact, the theories are inadequate in that the solar cycle is NOT yet fully predictable including why it has an 11-year period???? (Wikipedia: Solar cycle). If you CANNOT predict a basic fact of a phenomenon (i.e., the 11-year period), then clearly you do NOT have a complete theory.
- Associated with sunspots are other solar activities: solar active regions (regions of strong and complex magnetic field), prominences, solar flares, and coronal mass ejections.
- See also Sun keywords below (local link / general link: keywords_sun.html):
- EOF
- Solar atmosphere videos below (local link / general link: solar_atmosphere_videos.html):
- Image 2 Caption: As well as the reversals of the north pole-south pole polarity of the solar magnetic field between the two 11-year phases (on average) of the Hale cycle (22 years on average), there also tend to be reversals of polarity of sunspot pairs. To be exact, in the hemisphere of the overall north pole, the north pole of pair leads in the solar rotation eastward and the south pole of the pair trails. In the hemisphere of the overall south pole, it is the opposite. When there is a overall polarity reversal of the solar magnetic field Sun's polarity, you get the change illustrated in Image 2.
- Credit/Permission: ©
Robert A. Rohde (AKA User:Dragons flight),
2013 /
Creative Commons
CC BY-SA 3.0.
Image link: Wikimedia Commons: File:Sunspot Numbers.png.
- Credit/Permission: ©
David Jeffery,
2004 / Own work.
Image link: Itself.
- Credit/Permission: NASA,
Goddard Space Flight Center (GSFC)
David Hathaway,
circa or before 2003
(uploaded to Wikimedia Commons
by User:Taiwania Justo
2017)/
Public domain.
Image link: Itself.
Download site: Wikimedia Commons: File:Sunspot-bfly.gif.
-
Images:
File: Sun file: sunspots_solar_cycle.html.