
Image 1 Caption: For the Sun, the solar sidereal rotation rates for solar latitudes 0°, 15°, 30°, 45°, and 60° from r/R_☉=1/2 to the solar photosphere (i.e., r/R_☉=1).
Image 1 clearly shows the differential rotation of the solar interior.
Features:
- The horizontal axis
is radius in
units of the
solar radius
defined to be at the point
optical depth 2/3 into the
solar photosphere
(see Wikipedia: Solar radius).
Note 1 R_☉ = 6.957*10**8 m = 0.004650 astronomical units (AUs) = 109.1 Earth equatorial radii. This value may be a mean value: the source Wikipedia: Solar radius is a bit unclear.
- The vertical axis is
frequency f=Ω/(2π)
measured in nanohertz (1 nHz=10**(-9) Hz).
Note, a frequency of once per
year
∼ 1/(π*10**7 s) ≅ 3*10**(-8) Hz = 30 nHz.
- To convert the plotted frequencies to
sidereal period (i.e.,
period relative
to the
observable universe)
in days use the following
formula:
p = (11574.074074 ... days)/f_nHz ≅ ( 26.60706683695189 ... days)/(f_nHz/435 nHz) ,
where f_nHz is frequency in nanohertz and 435 nHz is a fiducial value for the internal solar sidereal rotation rate as Image 1 itself shows.
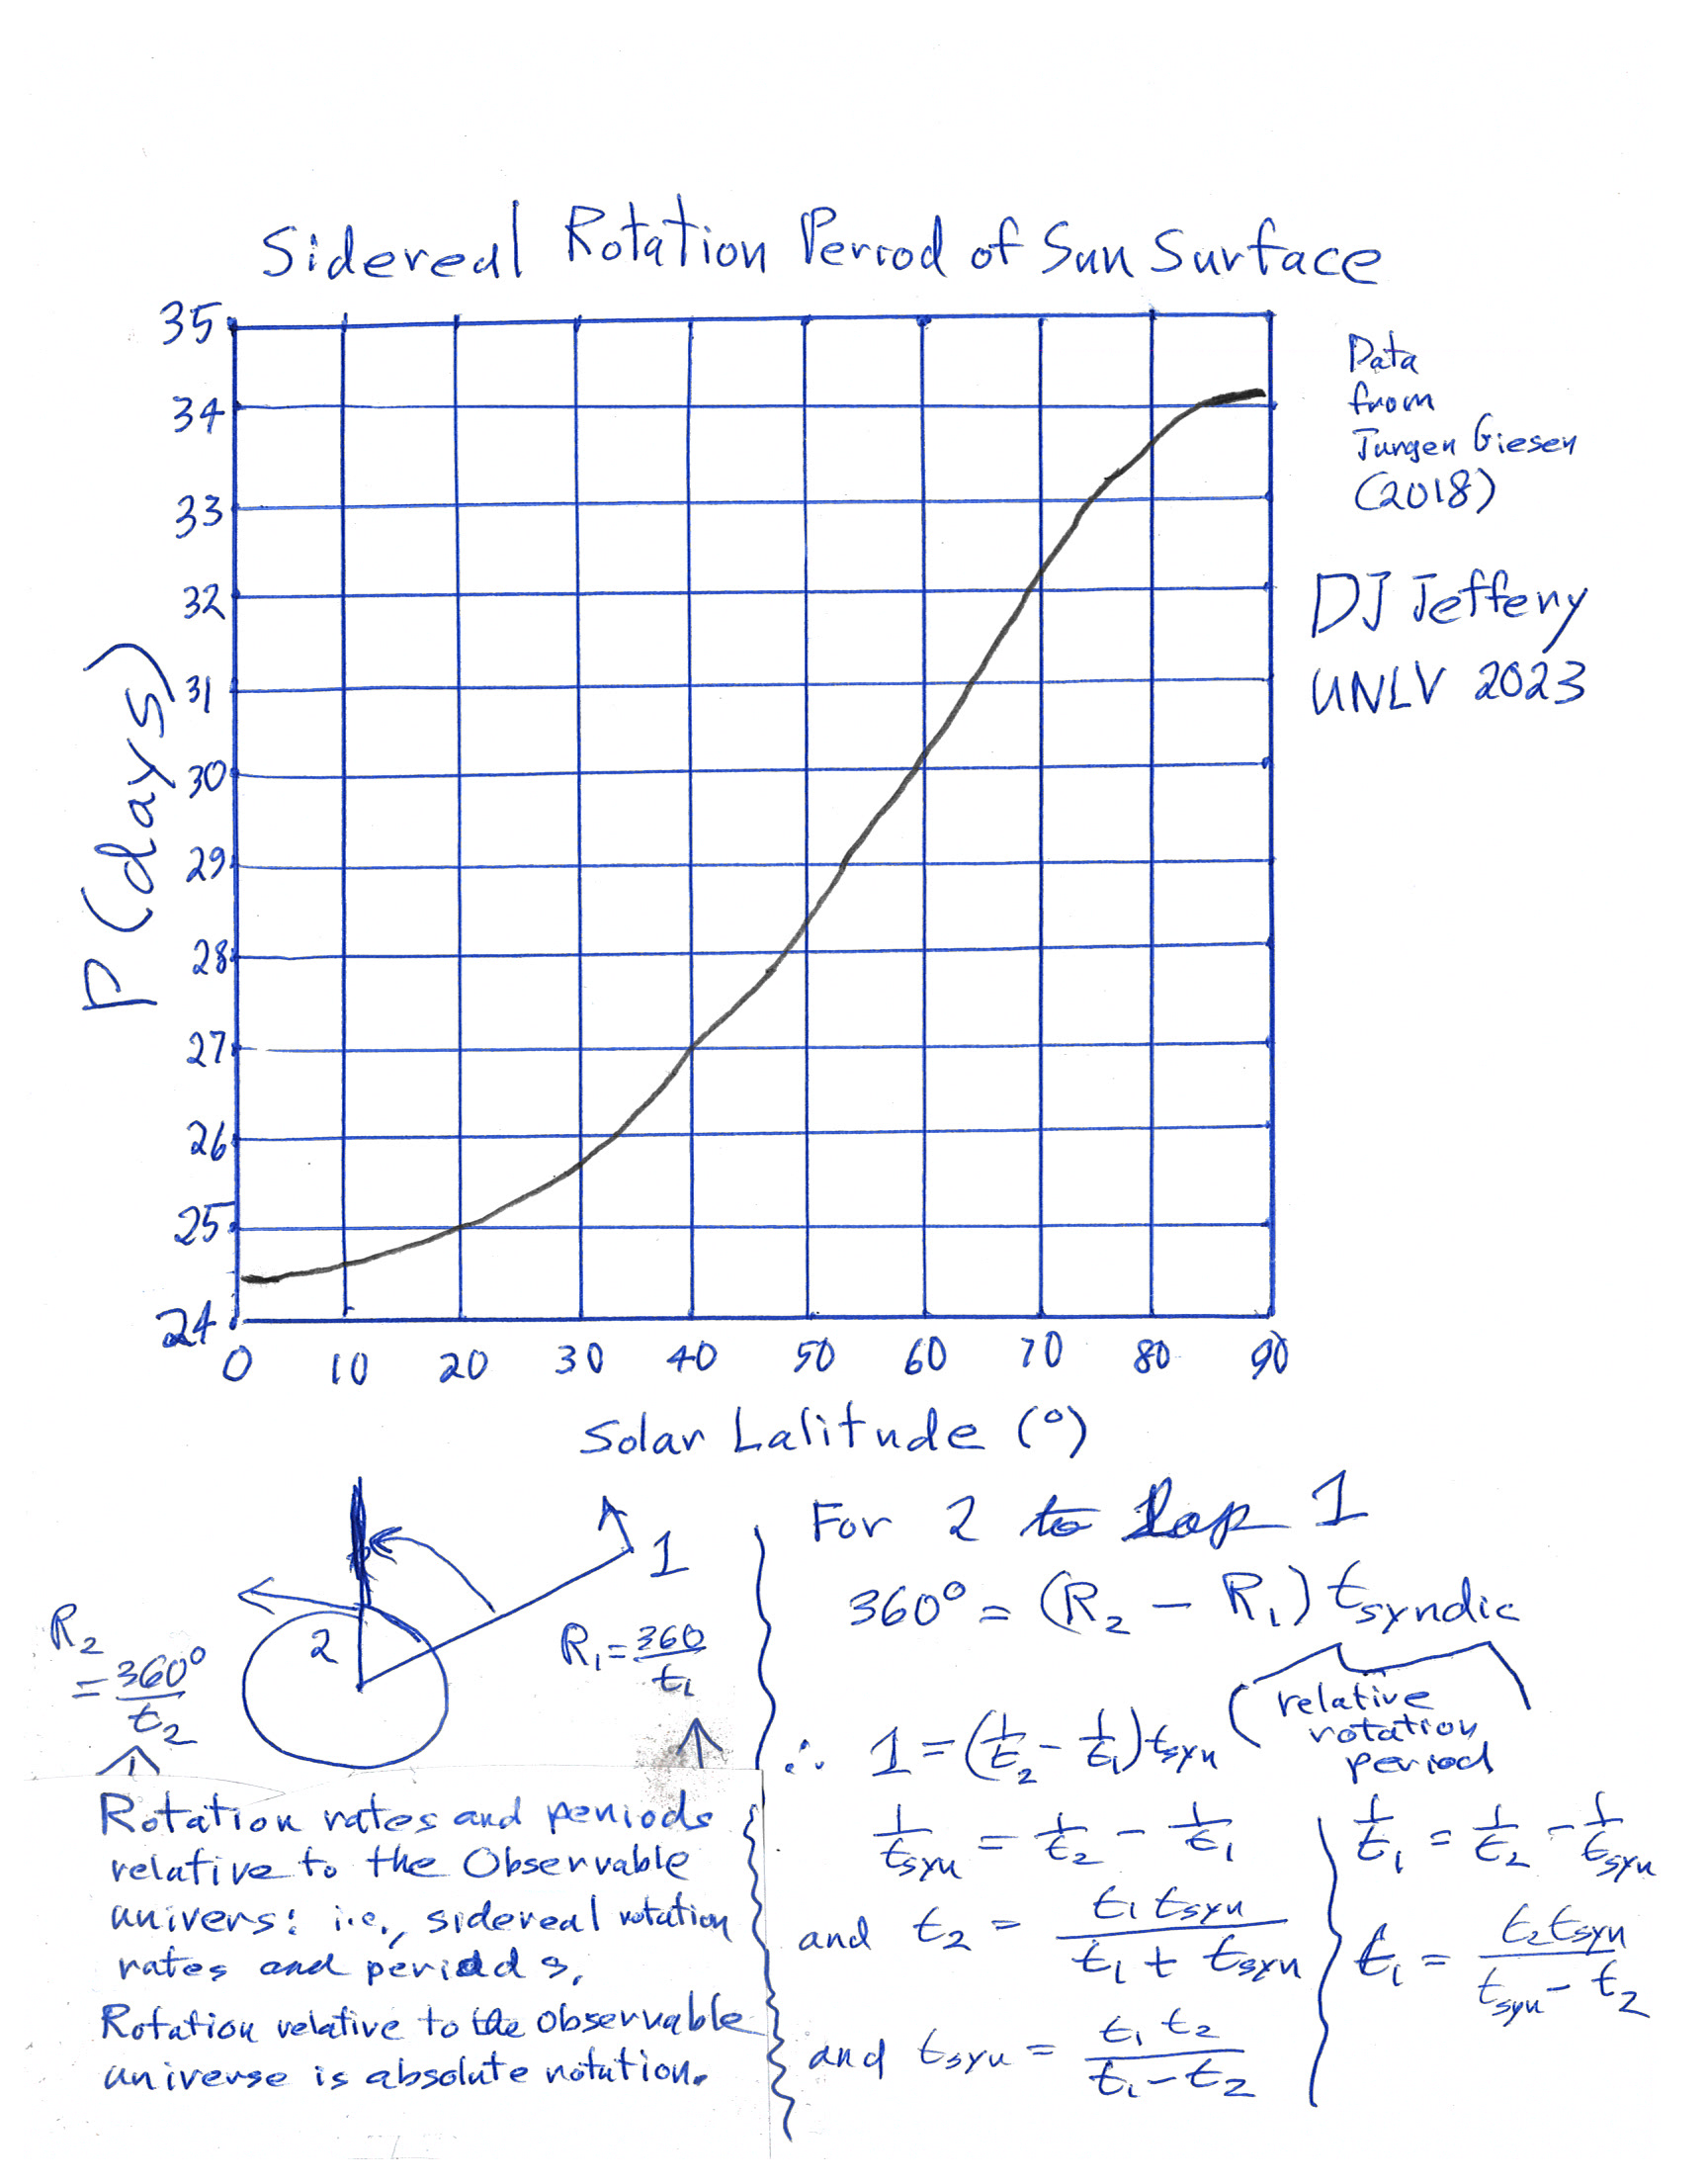
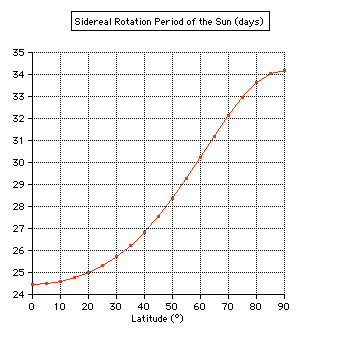
- Image 2 Caption: This plot shows the solar sidereal rotation period (i.e., the rotation period relative to the observable universe) as a function of solar latitude.
- The values for the solar sidereal rotation period obtained form formula values above and frequencies obtained casual inspection of Image 1 are probably NOT so good. The Image 1 gives 0° and 60° latitude surface solar sidereal rotation periods as, respectively, 25.7 days and 31.3 days, but but the measured values are 24.47 days and ∼ 30.2 days as can be verified approximately by inspection of Image 2 (see also Wikipedia: Solar rotation: Sidereal rotation).
Maybe Image 1 is NOT meant to be extrapolated to the solar photosphere.
The observed 90° latitude limit surface solar sidereal rotation period is ∼ 34 days (see Image 2).
- Remarkably, the rotation rate inward of about 0.65 R_☉ is nearly CONSTANT---the curves for the different solar latitudes converge to a nearly CONSTANT value of about 435 nHz implying a ∼ 26.6 day sidereal period as seen from the formula above.
This means the deep interior region rotates nearly as if it were a rigid-rotor solid sphere even though it is NOT: it's a sphere of gas.
The radius 0.65 R_☉ also approximately divides the inner solar radiative zone from the outer solar convective zone. The transition between these two zones is the tachocline.
- How do we know about the solar rotation rates?
The surface ones were mostly directly observed long ago by tracking the motions of sunspots: the sunspots largely move with the solar rotation rates for solar latitudes where they appear.
Galileo (1564--1642) and his contemporaries used sunspots to determine early solar rotation rates (see Wikipedia: Solar rotation: Using sunspots to measure rotation: Galileo's Letters on Sunspots (1613)).
The interior solar rotation rates were learnt from helioseismology: the study of solar oscillations. The solar oscillations are observed on the surface and can then be used to infer the interior solar rotation rates and other interior features.
- For more on solar rotation, see Solar rotation videos below (local link / general link: solar_rotation_videos.html):
- Image 2 Caption: This plot shows the solar sidereal rotation period (i.e., the rotation period relative to the observable universe) as a function of solar latitude.
-
Images:
- Credit/Permission: ©
Global Oscillation Network Group (GONG),
2008
(uploaded to Wikipedia
by User:KeepOpera,
2010) /
Creative Commons
CC BY-SA 3.0.
Image link: Wikipedia: File:Tachocline.gif.
- Credit/Permission: ©
David Jeffery,
2023 /
Own work.
Image link: Itself.
Data source: Jurgen Giesen, 2018. See Jurgen Giesen: Solar Rotation Applet and Jurgen Giesen: Sidereal Rotation Period of the Sun (days).
File: Sun file: solar_rotation.html.