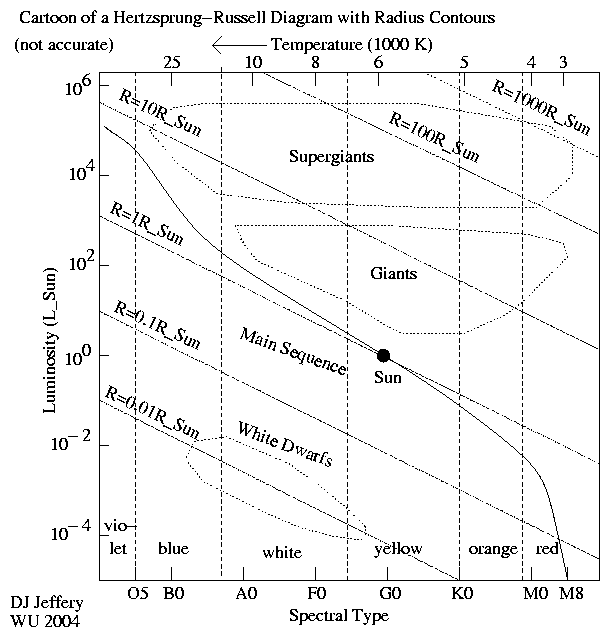
Caption: A cartoon of a Hertzsprung-Russell (HR) diagram with contour lines of constant radius (NOT quantitatively accurate) (FK-428).
Features:
- The luminosity
of a star approximated as
a blackbody radiator is
L = (4πR**2)*σT**4 ,
where T is the effective temperature (a sort of average photospheric temperature), R is photosphere radius, the Stefan-Boltzmann constant σ = (5.670374 19 ...)*10**(-8) W/*m**2/K**4 (exact) (see NIST: Fundamental Physical Constants --- Complete Listing 2018 CODATA adjustment)), and Stefan-Boltzmann law of blackbody spectra F = σ*T**4 is used to get the emitted flux per unit area. - On a HR diagram
(which is a log-log plot),
the luminosity
formula becomes
the logarithmic
formula
log(L) = 4*log(T) + 2*log(R) + log(4πσ) .
Recall that photospheric temperature (roughly the same as the effective temperature) increases to the left on a HR diagram in astronomy wrong-way fashion, and so log(L) increases/decreases going left/right. - The logarithmic
luminosity log(L)
plotted on an HR diagram
gives contour lines
of constant radius
that are straight lines
rising to the left
with slope
4
which are separated by
factors
of 100
for every increase of 10
in radius
(as follows clearly from the formula
L = (4πR**2)*σT**4).
This behavior is illustrated in the image.
- Note for the contour lines
of constant radius we have the following
approximately:
- R = 0.01 R_☉ ≅ Earth equatorial radius R_eq_⊕ = 6378.1370 km crosses the white dwarf luminosity class. Therefore, typically white dwarfs are about the size of the Earth.
- R = 0.1 R_☉ just intersects the main sequence for M dwarfs.
- R = 1 R_☉ just intersects the main sequence for solar mass stars, but because the intersection angle is small stars near the Sun on the main sequence will have R ≅ 0.1 R_☉.
- R = 10 R_☉ crosses the supergiant and giant luminosity classes.
- R = 100 R_☉ crosses the supergiant luminosity class.
- R = 1000 R_☉ crosses the supergiant luminosity class just barely.
- For other R values, you must mentally interpolate, the contour lines of constant radius.
We must emphasize that the HR diagram in the image is just a cartoon, and therefore it and the luminosity classes shown are very approximate.
- Other behaviors are:
- For a fixed effective temperature T, the
luminosity L
increases with the size of the radiator: i.e., with
radius R.
Thus, R↑ L↑.
- For a fixed
luminosity L,
radius R increases as
temperature T decreases.
To explicate, as temperature decreases, the
flux (which is
energy per unit time per unit area) of a
blackbody radiator
decreases.
Area
and therefore radius must rise to compensate if
luminosity is held fixed.
Thus, T↓ R↑.
- For a fixed effective temperature T, the
luminosity L
increases with the size of the radiator: i.e., with
radius R.
Thus, R↑ L↑.
- We can the inverse of the above formula
L = (4πR**2)*σT**4
to determine to good approximation
the stellar radius:
i.e., the radius of the
photosphere
(FK-429).
The inverse formula is
R = sqrt[L/(4π*σT**4)] .
Note that we CANNOT measure stellar radius directly in almost cases because almost always stars CANNOT be resolved. The finite size of observed stars is a combination of twinkling (AKA scintillation) and diffraction. The former mostly for the naked eye and the latter mostly for the telescope where twinkling is reduced by aperture averaging.
Image link: Itself.
Local file: local link: hr_radius.html.
File: Star diagram file: diagram/hr_radius.html.