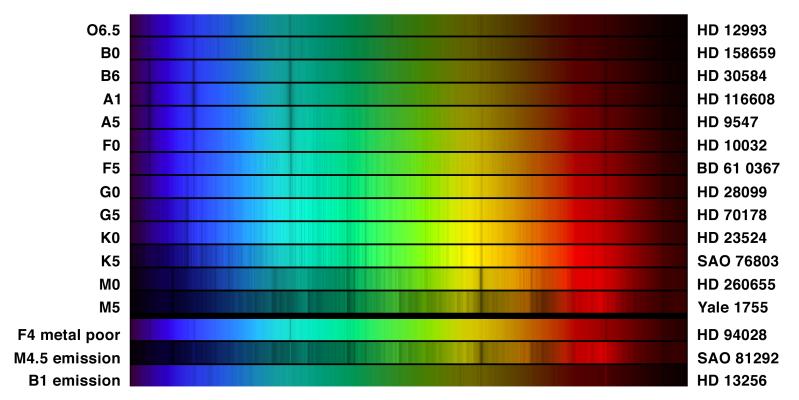
Caption: Image stellar spectra for the visible band (fiducial range 0.4--0.7 μm).
Features:
- The 13
top stellar spectra
show regular spectral types
from the
OBAFGKM stellar classification:
temperature decreases top to bottom.
The bottom 3 stellar spectra are special types.
- The spectral types are labeled on
the left side of the image.
- The right side of the image
gives the
star catalog name
for stars drawn from the
Henry Draper Catalogue (1918--1949),
Smithsonian
Astrophysical Observatory Star Catalog (1966),
Bonner Durchmusterung (BD),
and
Bright Star Catalogue
(Yale Bright Star Catalogue, YBS (1930--1991).
Note usually only bright stars have star proper names: i.e., the named stars. Also note that stars often have multiple names: e.g., star proper names, Bayer designations, and multiple star catalog names.
- The
hydrogen Balmer lines
(i.e., the visible band atomic hydrogen lines)
are strongest in absorption for A0--A5
A stars
which have
photospheric temperatures
of order 9000 K
(FK-424).
- In the image, the blue-green Hβ (486.132 nm) and
violet-blue Hγ (434.046 nm)
absorption lines are quite
apparent on and about the A1 spectrum
(FK-423).
- The red Hα (656.280 nm) is somewhat darkened out
for the A1 spectrum, but can still be made out
(FK-423).
- The sodium (Na) I double D lines (588.995, 589.592 nm)
in the yellow are quite noticeable for the M0 and M5
M stars
(FK-423).
The Na I double D lines
are the strongest lines of neutral
sodium.
They give low-pressure sodium-vapor lamps
their nearly
monochromatic
yellow light.
- As we know from Wien's law,
the maximum of a
blackbody spectrum
should shift to the
red as temperature decreases.
This is apparently shown in this image since bright zone forms a broad diagonal from upper right to lower left. But since colors in images can be easily manipulated, it is hard to know if we are really seeing this effect.
Download site: Astronomy Picture of the Day: 2001 May30; direct download site Astronomy Picture of the Day: 2001 May30. For the individual stars, see NOIRLab: noao0134a.
Image link: Itself.
Local file: local link: star_spectra.html.
File: Star file: star_spectra.html.