nasa_spectra.gif

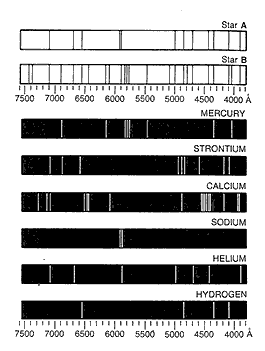
    Caption: Emission line spectra in image representation for stellar spectroscopy analysis in black-and-white and NOT color for some reason.

    Features:

    1. The horizontal axis is in angstroms and runs the wrong way, right to left.

      Note an angstrom (Å) = 10**(-10) m = 0.1 nm. It is a non-standard unit, but often used by spectroscopists and it is also the natural unit for atoms since atoms are of size scale 1 Å.

      The range of the horizontal axis is the visible band (fiducial range 0.4--0.7 μm) plus a bit more: 3800--7600 Å.

    2. The 2 upper spectra are absorption line spectra for actual stars. The spectral types of the stars are NOT identified by the figure source.

    3. The lower spectra are emission line spectra for particular atoms from the laboratory: hydrogen (H, Z=1), helium (He, Z=2), sodium (Na, Z=11), calcium (Ca, Z=20), strontium (Sr, Z=38), mercury (Hg, Z=80).

      Yours truly thinks all the atoms are neutral, except the calcium may be ionized (i.e., Ca II) since the Ca II K & H lines (with, respectively, λ = 393.366 nm and λ = 396.847 nm) seem to be present in the image.

    4. One uses the lower spectra to identify the absorption lines, and thus atoms, in the upper spectra.

    5. Hydrogen has arguably the most important spectrum for astronomy. In the figure, are shown the first 4 spectral lines of the hydrogen Balmer series (which are the visible band spectral lines of hydrogen): Hα (6564.5377 Å, red line), Hβ (4861.3615 Å, aqua line) , Hγ (4340.462 Å, blue line), Hδ (4101.74 Å, violet line).

    6. The hydrogen Hα (6564.5377 Å) red line is usually the strongest visible line of hydrogen. Hot interstellar gas (which is often in an H II regions) often emits this spectral line as an emission line and gives true color pictures of such interstellar gas a reddish or pinkish color.

    7. The sodium spectrum shows the 2 strongest sodium spectral lines: the sodium D lines (AKA Na I doublet). Actually, there are other fairly strong sodium spectral lines in the visible band which are NOT shown for some reason. The sodium D lines provide the near monochromatic light of sodium-vapor lamps (see Wikipedia: Sodium-vapor lamp: Low-pressure sodium).

    8. The Hα line and the sodium D lines can both be identified in the star A spectrum. Yours truly can only detect the Hα line in the star B spectrum.

    9. The videos below For short explanations of the formation of emission line spectra and absorption line spectra, see Spectroscopy videos below (local link / general link: spectroscopy_videos.html):

        EOF

    Credit/Permission: NASA, before or circa 2004 / Public domain.
    Download site: NASA: Imagine the Universe: but this image does NOT seem to be there anymore.
    Local file: local link: nasa_spectra.html.
    Display file: Star file: nasa_spectra_display.html.
    Image link: nasa_spectra.gif.
    File: Star file: nasa_spectra.html.