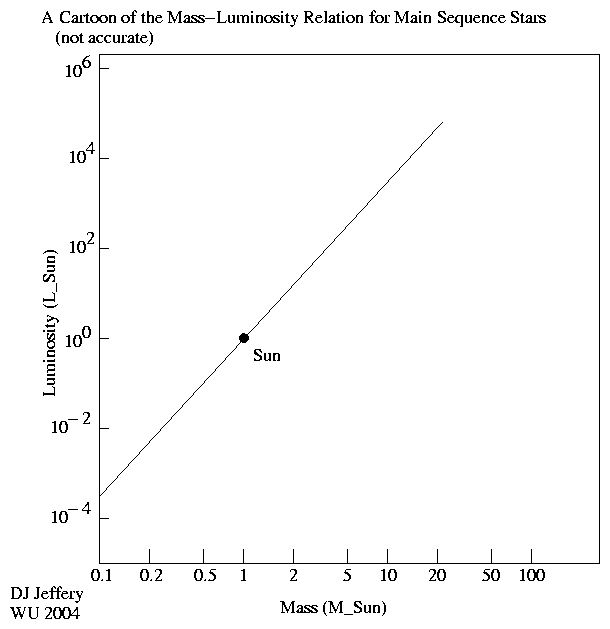
Caption: A logarithmic plot of the mass-luminosity relation for main-sequence stars. The line in the plot is NOT quantitatively accurate for any stellar mass range, but can be considered as a fiducial single-power mass-luminosity relation: the coefficient C is 1 and the power is 3.5 (see below for the meanings of coefficients and powers).
Features:
- The
mass-luminosity relation
for a stellar mass range
is approximately a power-law relation:
L/L_☉ ≅ C*(M/M_☉)p ,
where the Sun symbol ☉ indicates solar values, L is luminosity, M is stellar mass, C is a coefficient, and p is a power.Note, on a logarithmic plot a power-law relation becomes straight line with slope equal to the power.
The coefficients C and powers p for the stellar mass ranges are given in below Table: Stellar Mass-Luminosity Relation Parameters.
Table: Stellar Mass-Luminosity Relation Parameters
Reference: Wikipedia: Mass-luminosity relation.
coefficient C power p Mass Range (M_☉) Comment
0.23 2.3 0.08--0.43 1 4 0.43--2 If M_2 = 2M_1, then L_2 = 16L_1. 1.4 3.5 2--55 3200 1 55--∞ 1 3.5 Fiducial and plot
- An important consequence of the
mass-luminosity relation
is that
main-sequence stellar lifetime
decreases rapidly with
stellar mass even though the
amount of hydrogen fuel
increases with stellar mass.
The more massive the star, the more efficient
its hydrogen burning
and this more than negates having more
hydrogen fuel to use.
- To be quantitative, we can assume that the amount of
hydrogen fuel is proportional to
stellar mass M.
In which case:
t_lifetime ∝∼ M/L ∝∼ M**(-2.5) = 1/M**2.5assuming the fiducial mass-luminosity relation L/L_☉ ≅ (M/M_☉)**3.5.
From this formula, if stellar mass increases by 10, then main-sequence stellar lifetime decreases by 10**2.5 ≅ 300. By this result, a star of 10 M_☉ would have a main-sequence stellar lifetime of 1/300 that of the Sun. Thus, its main-sequence stellar lifetime would be 10 Gyr/300 = 10**4 Myr/300 = 30 Myr which is roughly correct (see Star file: star_lifetimes.html).
Local file: local link: mass_luminosity.html.
File: Star diagram file: diagram/mass_luminosity.html.