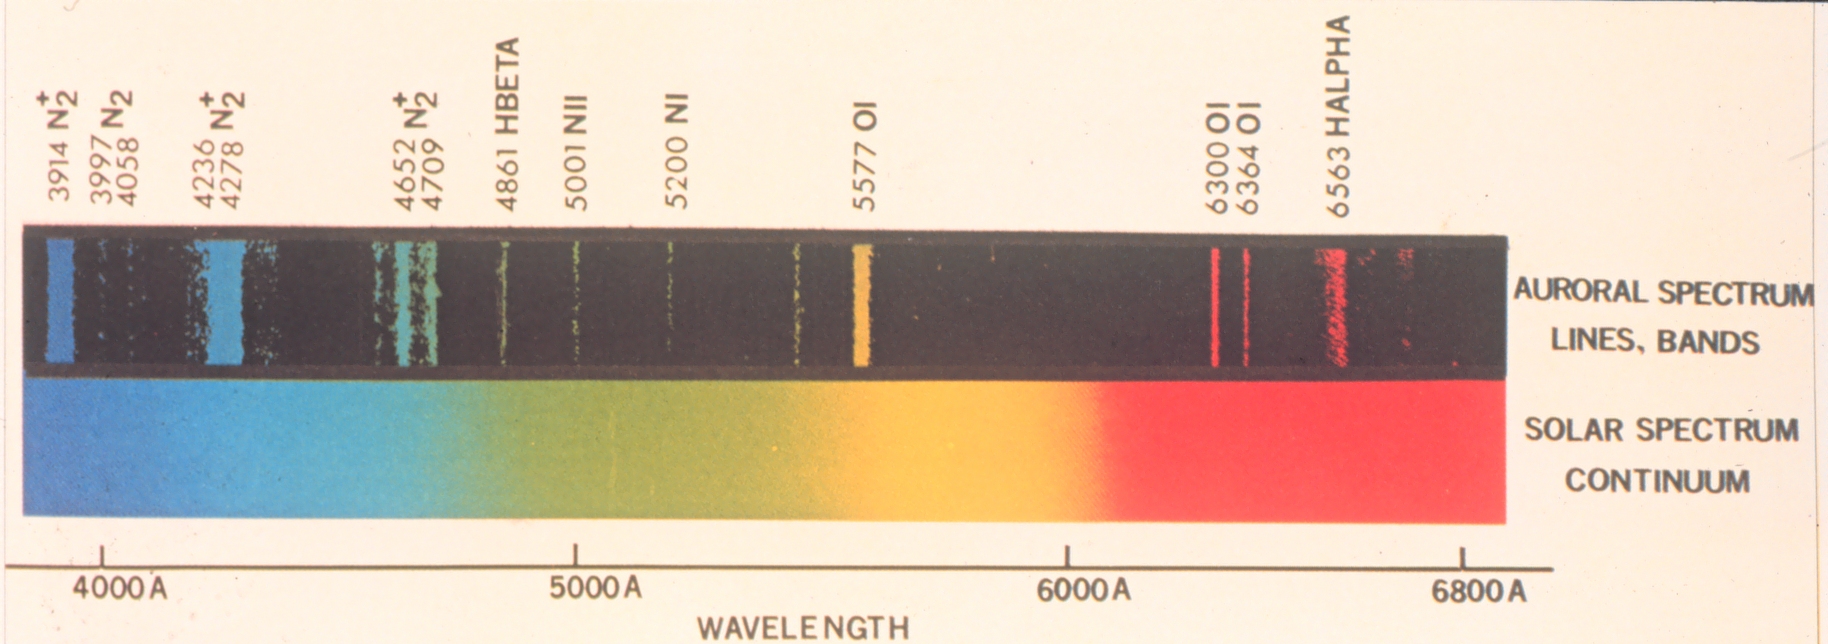
Caption: The aurora give rise to emission line spectra. Here is a typical aurora line spectrum compared to the solar spectrum NOT dispersed enough to show the Fraunhofer lines---or maybe they have been erased for clarity. The visible band (fiducial range 0.4--0.7 μm = 4000--7000 Å) with wavelength in angstroms (1 Å = 10**(-10) m).
The displayed aurora line spectrum analyzed:
- atomic hydrogen (H I) giving the Balmer lines Hα and Hβ. NOT seen in the image the weaker Balmer lines Hγ, Hδ, or Hε. See the Grotrian diagram grotrian_01_00_H_I.html.
- atomic oxygen (O I) giving some forbidden lines. See the Grotrian diagram 08_00_O_I.html.
- nitrogen (N) in various forms (molecular N_2, singly-ionized molecular N_2+, atomic N I, singly-ionized atomic N II) giving several emission lines. See Moore & Merrill (1968) p. 29 for atomic N I and p. 24 for once-ionized atomic N II.
See also See Earth aurora videos below (local link / general link: earth_aurora_videos.html):
Credit/Permission:
National Oceanic and Atmospheric Administration (NOAA),
before or circa 2003 /
Public domain.EOF
Download site: NOAA:
Image ID: wea01029, Historic NWS Collection;
Source: Collection of Dr. Herbert Kroehl, NGDC.
Alas, a dead link.
Image link: Itself.
File: Earth atmosphere file:
noaa_aurora_line_spectrum.html.