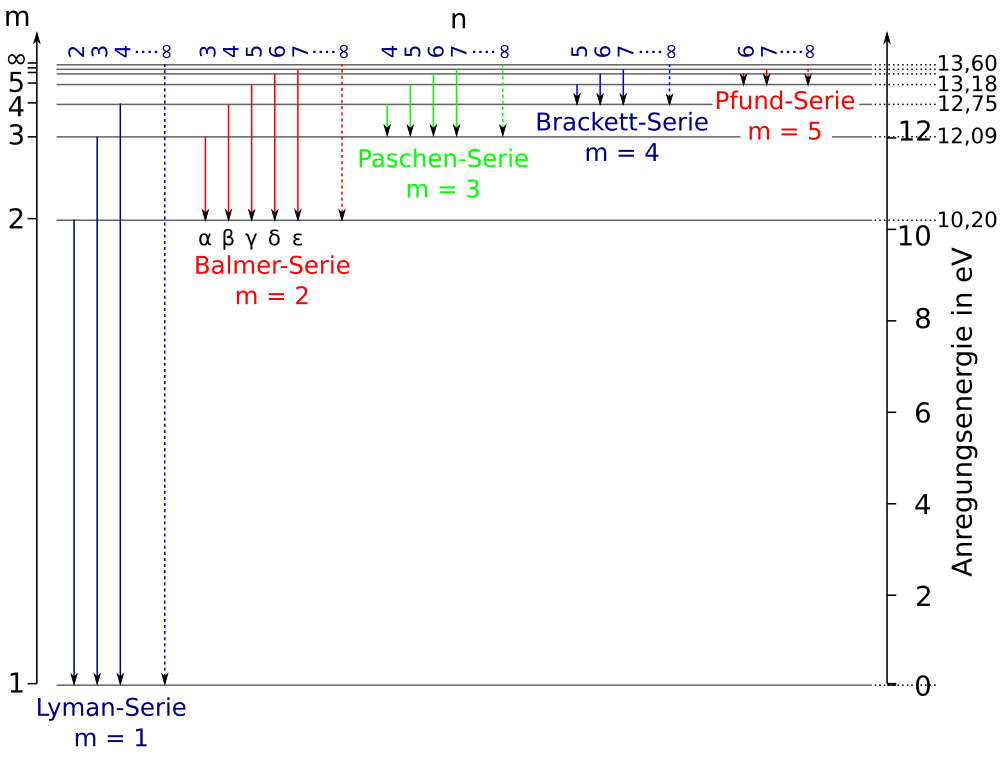
Caption: H I Grotrian diagram.
Features:
- Grotrian diagrams
are abstract diagrams
of atoms and
molecules.
The vertical axis is the energy
of the energy levels
relative to the
ground state
(i.e., the
lowest energy
energy level).
The energy unit here
is, as is usually the case, the
electron-volt (eV)
which is the
natural-unit
energy unit for
atomic and
molecular
energy levels.
The horizontal axis distinguishes the
energy levels by
quantities other
than energy
(often various quantum numbers).
Here the horizontal axis just distinguishes the
atomic hydrogen line series:
Lyman series,
Balmer series,
etc.
- The Grotrian diagrams labels are in
German. Just accept it.
- H I is
neutral hydrogen.
H II
is singly-ionized hydrogen which is
just a bare proton
and doesn't have any energy levels,
and therefore doesn't have a Grotrian diagram.
- The Grotrian diagram shows
the energy levels
and the atomic line transitions
for the neutral hydrogen
atom.
- For energy levels, we use values
for the ideal
hydrogen atom
(i.e., the hydrogen atom calculated without
any perturbation corrections
from
quantum mechanics perturbation theory
included, but using the correct
reduced mass).
- For
atomic line transitions wavelengths,
we use values tabulated by the
National Institute of
Science & Technnology (NIST)
(formerly the
National Bureau of Standards (NBS))
(Wiese et al. 1966, p. 2--4;
Wiese et al. 1966, p. 2--4, online), except that
we calculate the
hydrogen series limit wavelengths
from our energy levels using
the de Broglie relation
λ = hc/(E_n) = 1.23984197 μm/(-E_n) ≅ 1 μm/(-E_n) .
- The formula for
energies of the
energy levels of the ideal
hydrogen atom is
  E_n = -E_ryd*(μ/m_e)/n**2

      = -(13.5982 ... eV)/n**2  ,
where the
- Rydberg energy = 13.60569253(30) eV,
- reduced Rydberg energy E_ryd = 13.5982 ... eV,
- electron reduced mass μ=m_e/(1+m_e/m_p)=(0.9994 ...)*m_e,
- electron rest-mass energy m_e=0.510998910(13) MeV,
- proton rest-mass energy m_p=938.272046(21) MeV, energy is in electron-volts (eV) (1 eV = 1.602176565(35)*10**(-19) joules = 10**(-6) MeV),
- n is the principal quantum number which runs 1, 2, 3, ... , ∞ in order of increasing energy level energy for the hydrogen atom.
The zero point for the energies is zero energy of the continuum of energy states available to free (i.e., unbound) electrons.
- To get the energy measured from the
ground state
of the hydrogen atom, one uses formula
E_grd_n = E_n - E_1.
- To get the energy of a particular
transition,
one uses the formula
E = E_n_upper - E_n_lower.
- In the table below, we show the
hydrogen atom
energy levels.
 ____________________________________________________
 Table:  Energy Levels of the Ideal Hydrogen Atom
 ____________________________________________________
   n      E_n           E_grd_n
          (eV)            (eV)
 ____________________________________________________

   1    -13.598 ...     0.0000 ...
   2    -3.3995 ...    10.1987 ...
   3    -1.5109 ...    12.0873 ...
   4    -0.8498 ...    12.7483 ...
   5    -0.5439 ...    13.0543 ...
   6    -0.3777 ...    13.2205 ...
   7    -0.2775 ...    13.3207 ...
   ∞     0             13.5982 ...
 ____________________________________________________
- An important sample
of the atomic line transitions
for the hydrogen atom are tabulated below.
The wavelengths are for
air
NOT vacuum.
-
Table: Atomic Hydrogen Spectral Series:
- Lyman series n ≥ 2 → 1
transitions:
- Lyα n=2 → 1, λ=1.21567 μm, E=10.1987 ... eV
- Lyman limit n=∞ → 1, λ=0.91176 μm, E=13.5982 ... eV
- Balmer series n ≥ 3 → n=2 transitions:
- Paschen series
n ≥ 4 → 3 transitions:
- Paα n=4 → 3, λ=1.87510 μm, E=0.6610 ... eV
- Paschen limit n=∞ → 3, λ=0.8206 μm, E=1.5109 ... eV
- Brackett series
n ≥ 5 → 4 transitions:
- Brα n=5 → 4, λ=4.05120 μm, E=0.3059 ... eV
- Paschen limit n=∞ → 4, λ=1.4588 μm, E=0.8498 ... eV
- Pfund series
n ≥ 6 → 5 transitions:
- Pfα n=6 → 5, λ=7.4578 μm, E=0.1662 ... eV
- Pfund limit n=∞ → 5, λ= 2.2794 μm, E=0.5439 ... eV
- Humphreys series
n ≥ 7 → 6 transitions:
- Huα n=7 → 6, λ=12.3680 μm, E=0.1002 ... eV
- Humphreys limit n=∞ → 5, λ= 3.2823 μm, E=0.3777 ... eV
- No name series n ≥ 8 → n ≥ 7 transitions
- Lyman series n ≥ 2 → 1
transitions:
Credit/Permission: ©
User:Kiko2000,
User:Cepheiden,
2000 /
Creative Commons
CC BY-SA 3.0.
Image link: Wikipedia:
File:Wasserstoff-Termschema.svg.
Local file: local link: grotrian_01_00_H_I.html.
File: atomic/grotrian file:
grotrian_01_00_H_I.html.