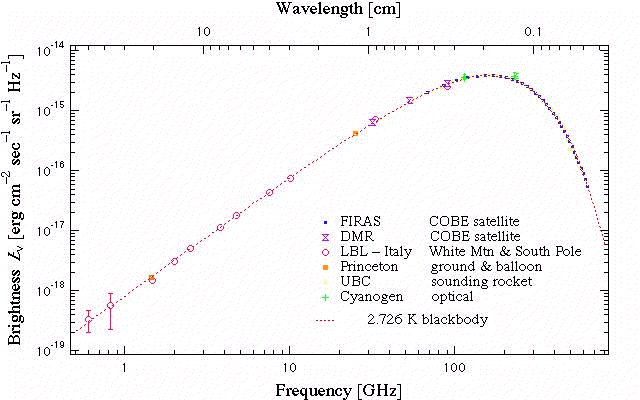
 Cosmic Microwave Background (CMB) from COBE and other detectors.
The plot is logarithmic on all three axes.
The microwave band by one convention is redward of 0.1 cm; blueward is infrared (HZ-54).
The data is excellently fit by a blackbody spectrum CMB T = 2.72548(57) K (Fixsen 2009) (see also Wikipedia: Cosmic microwave background radiation: Features).
Credit: CMB Astrophysics Research Program: COBE site This is a Lawrence Berkeley Lab site reporting on George Smoot's group.
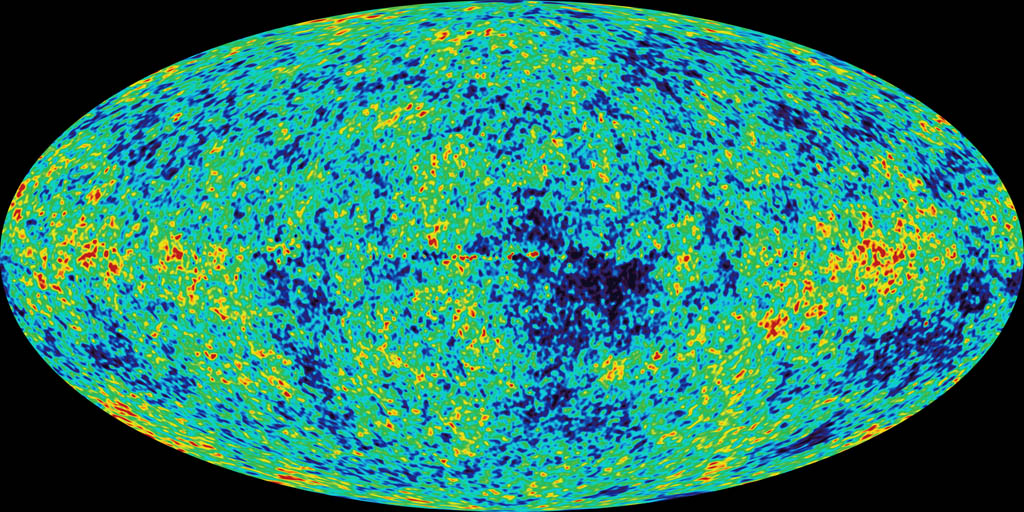 Cosmic Microwave Background (CMB) all-sky map from WMAP circa 2003.
Why is there no scale?
The average temperature is 2.725+/-0.001 K.
The colors code deviations in micro-Kelvins: dark blue (-200), green (0), red (+200).
Credit: NASA/WMAP Science Team.
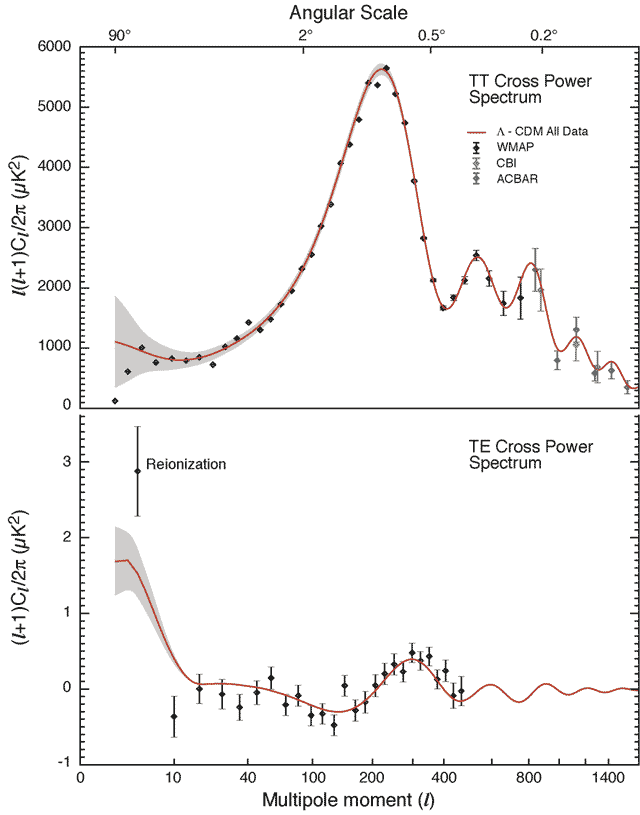 Cosmic Microwave Background (CMB) power spectrum from WMAP (2003).
But rather vaguely, the top plot shows of frequency of hot and cold spots of various angular sizes on the sky (FK-652--653). Large spots are on the left; small spots on the right.
The data points come from the WMAP satellite and other detectors.
The curve is fit to the data???---but with how many free parameters---of what is called a scale-invariant power spectrum which is a prediction of most inflation models irregardless of the details of the inflation mechanism (CL-263,265,274--275; Gr-309).
The fact that inflation predicted the observations is an astonishing triumph of the inflation idea.
It does NOT prove inflation, but it certainly strongly supports it.
Credit: NASA/WMAP Science Team.