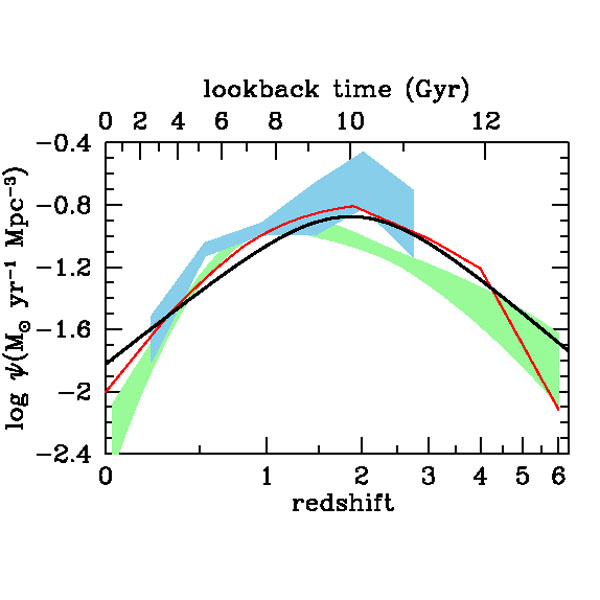
Caption: Click on the shown image to get the desired image, a logarithmic plot of cosmic star formation history in the observable universe over cosmic time since lookback time ∼ 13 Gyr (i.e., cosmic time ∼ 1 Gyr) (Piero Madau, Mark Dickinson, 2014, Cosmic star formation history; reprinted Piero Madau, Mark Dickinson, 2014, Cosmic star formation history). Ignore the other plotted features.
Features:
- The lower
horizontal axis
is logarithmic
cosmological redshift z,
the upper
horizontal axis is
logarithmic
lookback time,
and the vertical axis
is logarithmic
comoving star formation rate density (SFRD, 𝜓)
in solar masses
per year
per cubic
megaparsec (Mpc).
Note, the the curve for 𝜓 is a smoothed fit to data points with error bars.
- Note,
star formation began with
cosmic dawn (AKA reionization era,
z∼6--20, cosmic time c. 150 Myr--1 Gyr in the Λ-CDM model).
Then had a broad maximum
in 𝜓
cosmic noon (z∼1.5--2.5,
cosmic time ∼ 3--4 Gyr, lookback time ∼ 10--11 Gyr).
Since then, the
observable universe has been in
cosmic afternoon
with cosmic present z = 0, t_0
= to the age of the observable universe = 13.797(23) Gyr (Planck 2018)
where 𝜓
is ∼ 1/9
of that at the maximum according to the
plot.
- What does "comoving" mean in the quantity
comoving star formation rate density (SFRD, 𝜓)?
An explication follows.
Consider a cube in in the observable universe. Its volume V scales as with cosmic time t as
V = V_{0}a(t)**3 = V_0/(1+z)**3 ,where a(t) is cosmic scale factor of the universal expansion, cosmic time t is measured from the Big Bang era at lookback time the age of the observable universe = 13.797(23) Gyr (Planck 2018), z is cosmological redshift, and V_0 is the constant comoving volume which is equal to V at cosmic present z = 0, t_0 = to the age of the observable universe = 13.797(23) Gyr (Planck 2018).For a large enough cube comoving volume V_0, the amount of matter (baryonic matter and dark matter) in the cube is contant throughout cosmic time. Given the cosmological principle, this amount is the same for any cube of comoving volume V_0 in the observable universe.
"Comoving" in comoving star formation rate density (SFRD, 𝜓) means that the density is calculated for comoving volume V_0 and NOT the actual volume V for each cosmic time indicated on the plot. Using comoving volume rather than actual volume seems to be preferred for understanding cosmic star formation history. Among other things, it compresses the vertical behavior of cosmic star formation history on plots.
If comoving star formation rate density (SFRD, 𝜓) was changed to non-comoving star formation rate density (SFRD, 𝜓), then there would be a decrease in 𝜓 by ∼ 1/[9*(1+2)**3] = 1/(9*3**3) = 1/81 since z=2 (which would NOT be the maximum of non-comoving star formation rate density (SFRD, 𝜓): that would have occurred earlier in cosmic time).
- The plot
dates from 2014 and many
new observations of the
observable universe
at low-z and high-z have been done since then, notably by the
JWST (2021--2041?).
So it is likely that updated versions of
plot will appear sometime soon.
But NOT anywhere yours truly can find circa
2025.
- To explicate the declining behavior of
comoving star formation rate density (SFRD, 𝜓)
since cosmic noon (z∼1.5--2.5,
cosmic time ∼ 3--4 Gyr, lookback time ∼ 10--11 Gyr),
see Galaxies file:
galaxy_quenching.html: Besides Galaxy Quenching, There Is a Universal Decline in Star Formation Rate with Cosmic Time.
Image link: figure15.jpg.
Image website: Piero Madau, Mark Dickinson, 2014, Cosmic star formation history: 5. From Observations To General Principles.
Placeholder image: alien_click_to_see_image.html. Local file: local link: cosmic_star_formation_history.html.
File: Cosmology file: cosmic_star_formation_history.html.