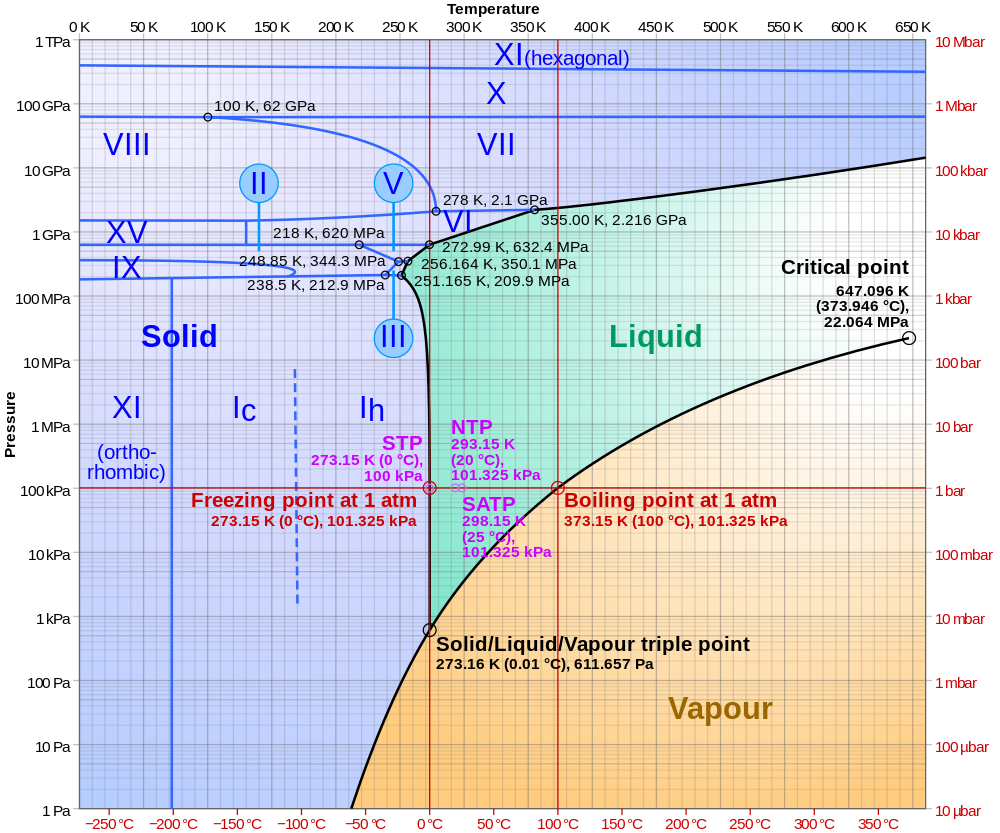
Caption: A phase diagram of water on a semi-log plot.
Features:
- The phase diagram applies to
thermodynamic equilibrium:
that timeless state where the
thermodynamic variables
are NOT changing.
- The horizontal axis
is temperature in
Celsius degrees (C) on the bottom
and
kelvins (K) on the top.
-
The vertical axis is
pressure in
pascals (Pa)
on the left-hand side
and in
bars
on the right-hand side:
1 bar
=
10**5 pascals (Pa)
=
100 kilopascals (kPa)
=
0.987 atmospheres (atm)
≅ the
air pressure near the
surface of the Earth.
- It helps to understand the plot by considering the horizontal level of
ordinary Earth-surface air pressure
which is at about 100 kPa = 10**5 Pa.
As one goes to the right, one passes through the three phases: ice, liquid water, water vapor.
-
Water vapor dissolved in
air exists in the
regions where water is
ice or
liquid water
as we well know.
- At different pressures,
condensation and
vaporization happen at different
temperatures.
- Now note that below a certain pressure
there is NO
liquid phase
(called the triple point in general),
and above
a certain pressure
(called the critical point
in general),
there is NO distinction between
liquid phase and
gas phase.
So the region where the
liquid phase exists as distinct
phase of matter is rather narrow.
This conclusion is true for all materials, NOT just water.
The upshot is that a distinct liquid phase is a rather delicate phase of matter and, in fact, in many astrophysical environments the pressure is too low or too high for it, and consequently many astrophysicists NEVER think of the liquid phase at all for any substance or material.
However, life as we know it requires liquid water, and so astrobiologists spend all their time thinking of liquid water.
- For water, the
triple point = 61173 Pa, 273.16 K
(where all three
phases of water can co-exist at once) and the
critical
point ≅ 22.064 Mpa, 647 K
(beyond which the distinction between
liquid water and
water vapor ceases to exist.
- Also for water,
there are known to be circa 2023
19
ice (sub)phases, but
the plot shows only
15
ice (sub)phases
numbered in Roman numerals I, II, III, ... , XV.
Image link: Wikipedia: File:Phase diagram of water.svg.
Local file: local link: phase_diagram_water.html.
File: Thermodynamics file: phase_diagram_water.html.