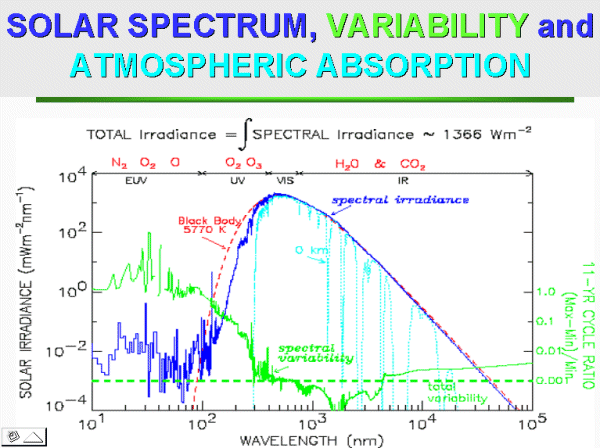
Caption: The solar spectrum in a log-log plot.
Features:
-
There is a blackbody spectrum fit
(dashed red line) to the
solar spectrum
above the Earth's atmosphere (dark blue line)
and also
the relative solar spectrum at
the Earth's surface in cloud-free conditions (light blue light).
The wavelength range extends from far UV to far IR.
- Because of the small scale,
the absorption lines in the
solar spectrum
have been mostly smoothed out.
A larger scale would show many them.
- Note that the solar spectrum
peaks in the visible.
- Note also that the Earth's atmosphere
is very opaque
in the ultraviolet (UV) and in
many broad absorption spectral bands
in the infrared (IR)
(due primarily to water vapor (H_20 gas)
and carbon dioxide (CO_2),
the two principal greenhouse gases
in the Earth's atmosphere),
but the
visible band (fiducial range 0.4--0.7 μm))
is pretty transparent.
The transparent bands are called
atmospheric windows
in astro jargon.
Download site: NASA Science.
Image link: Itself.
Local file: local link: solar_spectrum_graph_2.html.
File: Sun file: solar_spectrum_graph_2.html.