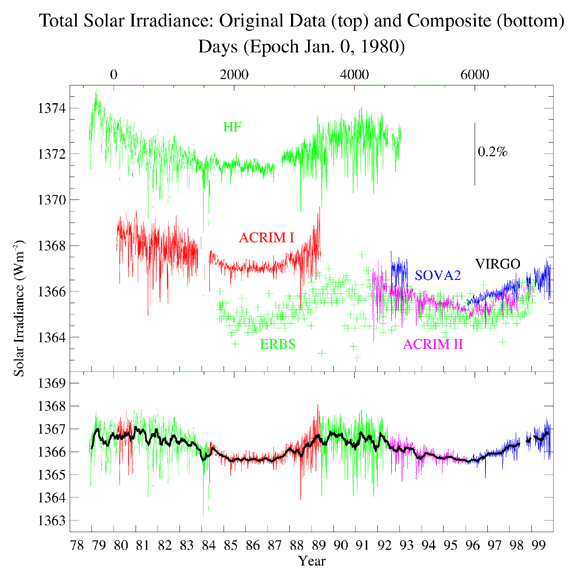
Caption: Just consider the lower panel of image where there is a plot of the solar constant for 1978--1999: i.e., essentially the last bidecade of the late, great 20th century.
Features:
- The solar constant
is the power per unit
area
at 1
astronomical unit (AU)
from the Sun:
i.e., at the mean
Earth-Sun distance.
- Note the circa-2023 reference
mean solar constant = 1360.8(5) W/m**2
(see Wikipedia: Solar constant:
Calculation;
NASA: Earth fact sheet:
solar irradiance, 2023).
This value is NOT what the plot
suggests which is ∼ 1366.5 W/m**2.
The data in the
plot
probably is based on an out-of-date measurement of
the mean solar constant.
- The plot shows
2 full
solar cycles.
A solar cycle is an approximately sinusoid in the value of the solar constant (forgiving the contradictio in terminis = contradiction in terms). The period of the solar cycle is on average 11 years.
- Smoothing over short-time variations (which are seen in the
plot),
the solar constant varies between a
solar maximum (solar luminosity ∼ 0.05 W ≅ 0.05 % above average)
and a
solar minimum (solar luminosity ∼ 0.05 W ≅ 0.05 % below average).
At solar maximum
sunspots are most numerous
and at solar minimum, they
are least numerous.
- The plot
actually confirms during a full solar cycle
that the solar constant
varies by only by ∼ 0.1 %
between maximum and minimum when the short term variations have been
smoothed away---which is what the
black curve
shows.
The rapid time variations in the plot are mostly due to sunspots. Each one causes a slight dimming of the Sun.
The plot clearly shows that sunspot number variation between solar maximum and solar minimum by showing more rapid variations at the former than at the latter.
- The near constancy of the solar constant
is good for life
on Earth as we know it.
If the solar constant had strong variations,
biosphere may NOT have evolved or would be
very different somehow.
- Actually, the solar constant
does NOT include the major periodic variation in the
solar power per unit area received at the top of the
Earth's atmosphere.
This variation is caused by the varying distance of the Earth from the Sun.
The solar power per unit area received at the top of the Earth's atmosphere varies over about 6.9% during a year from a low of 1321 W/m**2 in circa Jul05 when Earth is farthest from the Sun to 1412 W/m**2 in circa Jan03 when Earth is closest to the Sun (Wikipedia Solar Constant; Wikipedia: Earth's orbit: Events in the orbit).
If the distance variation were included, then the oscillations in the plot would go off the plot.
- Without the distance variation,
only the intrinsic variations in solar luminosity
are manifested in the plot.
Image link: Itself.
Local file: local link: solar_constant_time_plot.html.
File: Sun file: solar_constant_time_plot.html.