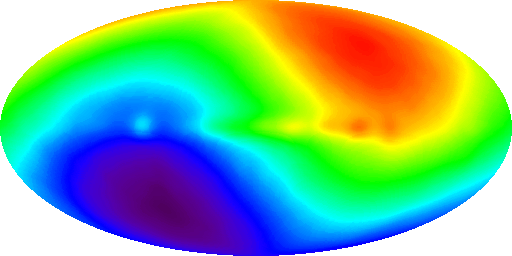
Caption: The cosmic microwave background (CMB) dipole anisotropy in a whole-sky sky map in Mollweide projection or some similar graphical projection.
Features:
- The sky map
shows the
CMB dipole anisotropy
temperature
anomaly
(i.e., difference from mean) of the
cosmic microwave background (CMB) temperature T = 2.72548(57) (Fixsen 2009).
The spectral colors (violet, blue, green, yellow, orange, red) represent the low to high temperature anomaly.
The sky map is a bit dated since it shows data from the COBE probe (1989--1993). However, the 2018 value for the time-constant amplitude of the anomaly is 3.36 mK = 0.00336 K (Planck 2018 results. III. (2018, p. 22)). Superimposed on the time-constant CMB dipole anisotropy is a small time-varying anisotropy of amplitude of is 271 μK = 0.271 mK= 0.000271 K (Planck 2018 results. III. (2018, p. 21)) which is NOT represented in the figure.
Note, anomaly (time-constant and time-varying) is everywhere very small compared to the (mean) CMB temperature T = 2.72548(57) (Fixsen 2009).
- The
CMB dipole anisotropy
is NOT intrinsic to the
CMB
as is the
CMB intrinsic anisotropies
(which are due to cosmological effects).
It is caused by the
Doppler shift
of the CMB
due to the translational motions
of Sun and
Earth relative to
the local-to-Earth
comoving frame
that participates in the
(mean) expansion of the universe.
Note, the
CMB
by modern
cosmological theory
is NOT Doppler shifted
in comoving frames.
The translational motion of Sun gives the time-constant CMB dipole anisotropy and the translational motion Earth (which is due to the Earth's orbital motion) gives the time-varying CMB dipole anisotropy.
In analyzing the CMB intrinsic anisotropies, the CMB dipole anisotropy is subtracted off the data as a first step.
Note, the Doppler effect (or shift) is covered in IAL 7: Spectra: The Doppler Effect.
- Using the Doppler effect formulae
(plus other information as needed),
we can determine
the velocities
of motions
relative to our local
comoving frame
and nearby local
comoving frames.
For example:
- The
Solar System barycenter
(i.e., center of mass
of the Solar System)
is moving at 368(2) km/s in some direction
(see
Wikipedia: CMB dipole anisotropy;
Caltech:
Description of CMB Anisotropies).
- The Milky Way
barycenter
is moving at 552(6) km/s in the direction
10.5 hours right ascension (RA),
0.24° declination (Dec or δ) in
equatorial coordinates
(epoch J2000)
which is toward near the center of
constellation
Hydra
(see Wikipedia: Milky Way: Velocity).
- Local Group of Galaxies
barycenter
is moving
at 627(22) km/s in some direction
(see
Wikipedia: CMB dipole anisotropy;
Caltech:
Description of CMB Anisotropies).
- The
Solar System barycenter
(i.e., center of mass
of the Solar System)
is moving at 368(2) km/s in some direction
(see
Wikipedia: CMB dipole anisotropy;
Caltech:
Description of CMB Anisotropies).
Image link: NASA: Fluctuations in the Cosmic Microwave Background.
Local file: local link: cmb_dipole_anisotropy.html.
File: Cosmology file: cmb_dipole_anisotropy.html.