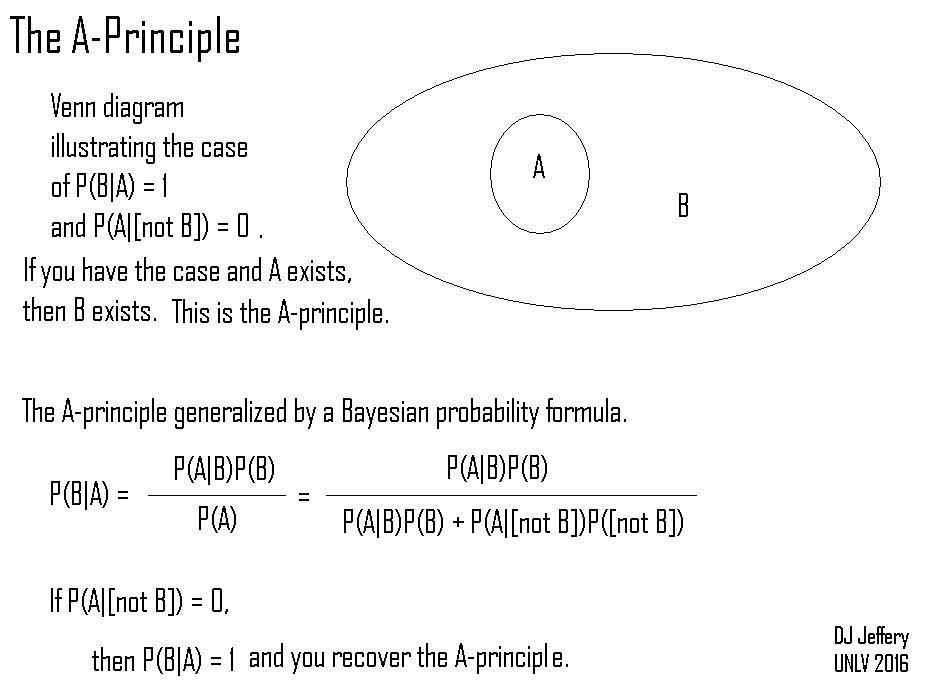
Caption: Venn diagram illustrating what yours truly calls the A-principle and its generalization by Bayes' theorem which is the root of Bayesian analysis.
The Venn diagram makes the A-principle clear.
The contour lines delimit statistical samples (i.e., subsets of the statistical population).
Since sample A is entirely inside sample B, we have conditional probability P(B|A) = 1 which is the A-principle itself.
-
In words,
the conditional probability of B given A
is 1.
So B exists if A does.
Logically equivalently, P(A|[not B]) = 0.
-
In words,
the conditional probability of A given [not B]
is zero---so
A does NOT exist if B does NOT exist.
Image link: Itself.
Local file: local link: a_principle.html.
File: Statistics file: a_principle.html.