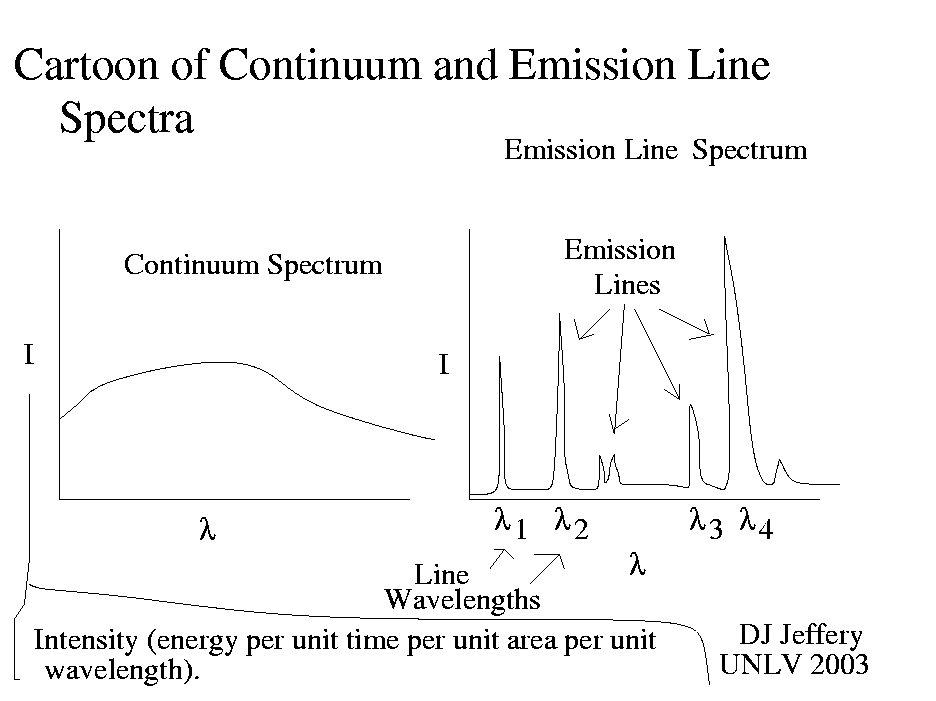
Caption: A cartoon of a continuous spectrum and emission line spectrum.
Each atom, molecule, and ion has a virtually unique set of lines, and therefore its line spectrum (either emission line spectrum or absorption line spectrum) is virtually its fingerprint. Thus, a line spectrum allows you to identify the species present in a gas.
With the right analysis tools, some other data, and modeling, line spectra will also tell you temperature, density, and composition.
On the other hand, a continuous spectrum tells much less.
If an observed continuous spectrum is at least approximately a blackbody spectrum, it will tell you the temperature of the source by fitting a synthetic blackbody spectrum to it.
Credit/Permission: ©
David Jeffery,
2003 / Own work.
Image link: Itself.
Local file: local link: spectrum_emission_line_cartoon.html.
File: Spectra file:
spectrum_emission_line_cartoon.html.