Line profile calculations from
Ganguly et al. (2021)
ON SYNTHETIC ABSORPTION LINE PROFILES OF THERMALLY DRIVEN WINDS FROM ACTIVE GALACTIC NUCLEI
(Submitted to ApJ)
arXiv posting
FITS files
All of the line profiles from this work are available as FITS files here. A simple python plotting script is also provided.
Steady models
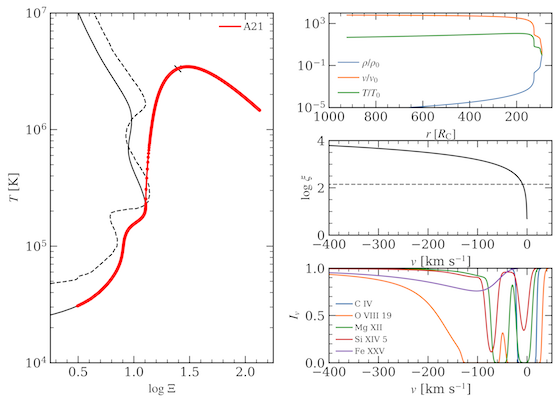
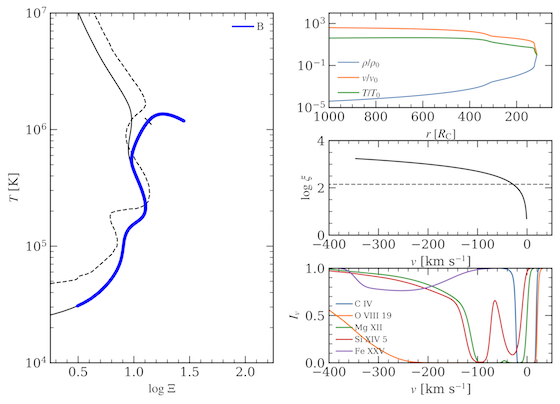
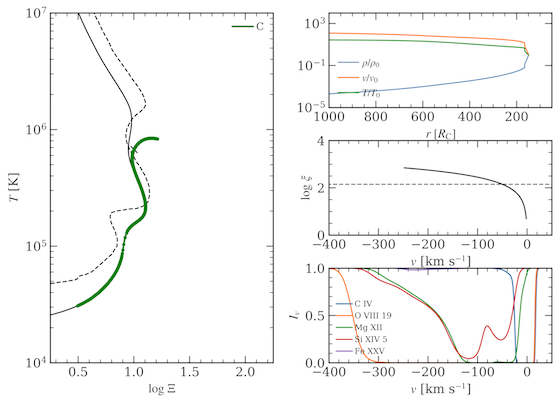
Models A21, B and C here are steady state versions of models A, B, and C from the work of Dannen et al. (2020), where these radial wind solutions were first presented. Model A21 is thermally stable and therefore will not become a clumpy wind solution even if perturbed. In contrast, models B and C are thermally unstable and become clumpy wind solutions upon introducing perturbations. In Dannen et al. (2020), these solutions never settled down to a steady state due to the use of a bilinear interpolation scheme for heating and cooling, which continually supplied numerical perturbations. As shown by Waters et al. (2021), upgrading to a bicubic interpolation scheme reduces the noise, allowing even unstable parameter regimes to reach steady state solutions.
The left panel on each plot below is a T-\Xi phase-space diagram showing the solution (colored dots) overplotted on the S-curve (solid line) and Balbus contour (dashed line). Notice that the unstable models B and C occupy the negative slope portion of the S-curve that is thermally unstable according to the criterion of Field (1965). In the plots on the right, the upper panel shows radial profiles of density, velocity and temperature, normalized to their values at the innermost radius. To aid comparison with the lower panels, the inner boundary is at the right side of this plot and radius increases to the left. The second panel shows the ionization parameter plotted against velocity, adhering to the convention that outflowing velocities are negative. The bottom panel shows a selection of line profiles for ions covering a large range of ionization energies.
Clumpy models
We now present animations of time evolution of the above synthetic absorption line profiles.
In the paper, we analyzed just a single snapshot from these time-dependent solutions because the evolution occurs on very large timescales (time is shown in kyrs), as these solutions are at parsec scales from the central engine.
In model B-c, notice that non-monotonic features (stronger absorption troughs at higher velocities) appear in the blue wing once the clumps start to form periodically in the outflows. Different lines can show dramatically different behavior. For example, the initial steady state flow (as shown above or in the first frame here) shows weak absorption and higher blue-shifts in the FeXXV line, whose line center eventually moves towards lower velocities and gets slightly stronger. This is opposite the trend in Mg XII, which probes the cold gas within clumps rather than the hot gas between clumps. The line absorption in O VIII is very strong over a wide range of velocities because this ion is very abundant throughout the outflow.
Model C-c, as discussed in the paper, is a highly clumped solution and the line profiles are therefore smoothed out, making it hard to infer that clumps are present.
Acknowledgements
Support for this work was provided by the National Aeronautics and Space Administration through Chandra Award Number TM0-21003X issued by the Chandra X-ray Observatory Center, which is operated by the Smithsonian Astrophysical Observatory for and on behalf of the National Aeronautics Space Administration under contract NAS8-03060. This work also was supported by the National Aeronautics Space Administration under ATP grant NNX14AK44G. MG is supported by the ``Programa de Atracci\'on de Talento'' of the Comunidad de Madrid, grant number 2018-T1/TIC-11733.
(Submitted to ApJ)
arXiv posting