- World Energy Consumption
First of all remember, world energy consumption equals world energy production---almost exactly.
For individual countries, production and consumption are usually unequal and often far apart.
We don't store energy essentially.
-
For example,
consider
the US
Strategic Oil Reserve (SPR).
The US SPR is currently, 724 Mbl = 0.724 Gbl which is a bit below capacity of 727 Mbl=0.727 Gbl (Strategic Petroleum Reserve).
The US SPR is the world's largest (see Wikipedia: Global strategic Petroleum Reserves).
The SPR is enough to satisfy the current world usage for 1--2 weeks.
US consumption alone is currently 7.1 Gbl/year ( Energy Information Administration (US Gov. Agency): US consumption).
So the US SPR for the US alone would last only 0.1 years at current consumption.
The SPR would be used stategically in a national emergency.
But the point is there is not a lot of stored energy.
16 TW = 16*10**12 W which turns into 500 XJ/year = 500*10**18 J/year but care I for exajoules. (World Energy Resources and Consumption (WERC)).-
My apologia for relying heavily
(but not entirely) on
Wikipedia.
It may NOT be the most authoritative source in the world, but unlike the others it doesn't hide its light under a bushel.
So as long as one treats its information as a first source, not a final one and one is cautious, it's extremely useful.
So world power per capita is
16*10**12 W / 6.8*10**9 = aprproximately 2000 W/capita .
There are two facts to keep in mind about the two numbers----16 TW for world power and 2000 W/capita for average power per capita:- The world population is growing.
- To achieve developed country
lifestyle worldwide will probably take
much higher average power per capita.
The former fact probably looms larger in the problem of world food supply---but, of course, world food supply is also related to world energy future in many ways.
- World Energy Trends
The following image shows the world energy trends circa 1966--2006.

Caption: "Graph created from the data in the BP 2006 statistical review. More details about the reference can be found in the en:World Energy article."
The diagram is for energy from primary energy sources.
This energy gets turned into other forms and those into other forms often and so on.
You'd be multi-counting the ``same'' energy if you kept counting the transformed energy too.
Author: Frank van Mierlo in 2007.
Linked source: Wikipedia image http://en.wikipedia.org/wiki/Image:World_Energy_consumption.png.
Use under GNU Free Documentation License.
As one can see, the world is overwhelmingly dependent on fossil fuels for commercial energy. As of 2004, about 86 % of world primary energy production was from fossil fuels (WERC: Fossil Fuels). Let's look the main fossil fuels briefly here. We'll look at them more extensively below.
- As one can see
oil (in the sense
of petroleum) is the leading
source of energy, but production seems to be plateauing.
It could be that we are at Peak Oil, but this under intense debate---we'll look into that debate in section Oil: The Long Goodbye below.
Peak Oil is the maximum of oil production after which oil production mostly declines---maybe only declines---and never again reaches its former maximum.
Oil is overwhelmingly used in the transport sector.
This is because it's a fluid and so easy to transport in pipes and because it is energy dense: 41.868 MJ/kg which is a fiducial number since oil's energy density varies widely (Wikipedia: Energy Units).
It's also a liquid, and so it energy per unit volume is high.
- Coal production is
rising steeply: this may be mainly due to the dramatic increase in
coal power in China
(see Wikipedia: Coal power in China).
Coal is usually considered quite abundant. Peak Coal is further off. Maybe 100 years off---but maybe not.
In the modern world, most coal is used to generate electric energy which is the most versatile of all commercial energy forms.
We discuss electric energy below in the section Electric Energy: Mr. Versatile.
But there are no primary sources for electric energy that we can access.
As a solid, coal is harder to manipulate than a fluid like oil, and so coal is not directly in transport or much in heating and cooking nowadays in the developed world.
But in the 19th century, Old King Coal was used directly in ships and trains and heating and industry of all kinds.

Caption: "Stephenson's Rocket 1829, the winner of the Rainhill Trials."
The record buster.
Built by George Stephenson (1781--1848).
Credit: Mechanics magazine, 1829.
Linked source: Wikipedia image http://en.wikipedia.org/wiki/File:Stephenson%27s_Rocket_drawing.jpg.
Permission: Public domain at least in USA.
Coal burns rather dirtly without air pollution controls.
It has a high energy density: 29.3076 MJ/kg which is a fiducial number since coal's energy density varies widely (Wikipedia: Energy Units).
It's also a solid, and so it energy per unit volume is high.
- Natural gas
(which is a gas mixture that is mostly methane CH_4)
is used to generate
electric power too, but
also in heating, transport, and
the manufacture of fertilizer.
Natural gas is abundant Peak Gas seems far off More than 20 years off probably---maybe much more.
It burns more cleanly than coal or oil---and produces less CO2 emission.
It's easily manipulated because it is a gas.
It's energy density is comparable to those of coal and oil: about 35 MJ/kg (Smil 2006, p. 16).
Natural gas's major drawback is that it is a gas.
Its energy per unit volume is low: in ordinary use gas densities, its energy density per unit volume is about 39 MJ/m**3 (see Methane: Fuel) which is of order a thousand smaller than the energy per unit volume of oil and coal.
This makes natural gas difficult to use in the transport sector.
One needs big tanks of high pressure natural gas.
They are bulky and rather explosion, because of the high pressure even if the natural gas does not ignite.
If one just extrapolated blindly from these curves from the last 15 years in the figure to 45 years into the future (i.e., to 2050), one would need 9 more terawatts.
-
Petroleum,
coal,
and
natural gas
dominate energy consumption.
They have each increased by about 1 terawatt in the last 15 years: so 3 terawatts altogether in 15 years.
Thus, in the next 45 years, one would see an increase of 9 terawatts.
But absolutely positively this calculation can only be taken as a suggestion of what the world may want in 2050.
To quote Yogi Berra (1925--), ``It's tough making predictions, especially about the future.'' (Wikipedia: Yogi Berra quotes).
My guru in energy matters, Vaclav Smil vehemently distrusts energy predictions.
In his book Energy at the Crossroads: Global Perspectives and Uncertainties, Smil has a whole chapter showing how over the years they are almost always wrong---and when they are right, it's mostly a case of if there are a lot of guesses, someone by chance will turn out right.
Why is this so? He argues that nature, technology, and society are just too complex in evolution and feedbacks to make reliable predicitons.
Smil argues that society should see what the possibilities are and then work toward what society wants.
What are the possibilities and what do we want?
Let's consider the latter first.
- World Energy Wants
This is not a thorough Christmas wish list, but a few considerations.
First consider the following plot.

Caption: "Note: Data is 2004 in 2000 US dollars. Graph was produced from data in the 2006 Key World Energy Statistics from the International Energy Agency. More details about the reference can be found in the en:World Energy article."
Credit: Frank van Mierlo in 2007.
Linked source: Wikipedia image http://en.wikipedia.org/wiki/Image:Energy_consumption_versus_GDP.png.
Use under GNU Free Documentation License.
There's a rough correlation between GDP/capita (Gross Domestic Product per capita) and power/capita.
You can say that is very roughly linear: as power/capita increases GDP/capita increases.
There's a lot of scatter about the line---which you need to imagine.
Is there a cause-and-effect relationship.
Pretty clearly there is.
If you have more energy, you can build more things, move more things, do more things, and make more things that you can sell to others.
Energy in rough fashion with a lot of scatter gives you wealth.
But can money ...

Caption: "Banknotes from all around the World donated by visitors to the British Museum, London".
Credit: User: Although in 2007.
Linked source: Wikipedia image http://en.wikipedia.org/wiki/Image:Banknotes.jpg.
Public domain at least in USA.
... buy you happiness

Caption: "The Laughing Cavalier by Franz Hals, 1624."
Actually, the Cavalier is not obviously laughing: his expression is engimatic to me.
Maybe he's merry or smug or philosophically resigned.
I actually saw the picture in the Wallace Collection in London in 1994jun.
Credit: Frans Hals (1580--1666).
Linked source: Wikipedia image http://en.wikipedia.org/wiki/File:Cavalier_soldier_Hals-1624x.jpg.
Public domain.
I'm sure up to a point it can---there is such a thing as having too little.

Caption: "The Potato Eaters (Aardappeleters in Dutch) is a painting by the Dutch painter Vincent van Gogh that he painted in April 1885 while in Nuenen, Netherlands. The painting is a oil painting on canvas and 82.0 cm x 114.0 cm (32" x 45") in size."
Credit: Vincent van Gogh (1853--1890)
Linked source: Wikipedia image http://en.wikipedia.org/wiki/Image:Vincent_Van_Gogh_-_The_Potato_Eaters.png.
Public domain.
But above that point---which is hard to define---most people would say more money doesn't make you happier.
Are the Italians less happy than the Americans because they have a lower GDP/capita?

Caption: "Collage of images representing the Italian people. Up (from left to right): Galileo Galilei, Michelangelo, Leonardo da Vinci, Alessandro Volta. Down (from left to right): Guglielmo Marconi, Maria Montessori, Maria Gaetana Agnesi, Giordano Bruno."
Credit: Wikipedia image http://en.wikipedia.org/wiki/File:Famous_Italians.png.
Public domain.
I think not. We've all heard of La Dolce Vita.
So we could be happy with an Italian GDP/capita of $18000.
But on the other hand, Bangladesh's GDP of $460 is probably too low.
So if everyone in the world had 4 kW/capita like Italy, then maybe that would suffice for worldwide Utopia.
Of course, South Africa has about 4 kW/capita too and GDP/capita of only about $5000 and are not all that happy as we know.
But anyway, let's say 4 kW/capita is ``modified rapture'' (W.S. Gilbert (1836--1911) in The Mikado).

Caption: "Geraldine Ulmar in The Mikado, 1885".
The The Mikado is an operetta by W.S. Gilbert (1836--1911) and Arthur Sullivan (1842--1900).
Credit: B. J. Falk. Uploaded by User Ssilvers in 2008.
Linked source: Wikipedia image http://en.wikipedia.org/wiki/Image:UlmarMikadoc.jpg.
Public domain.
Currently, the world is at 2.3 kW/capita according to the plot.
So in rough terms, if we could just about double the world's energy production and not double the world population, we might be doing OK.
So the world may need about 30 TW instead of the current 15 TW.
So what are our possibilities.
Can we go up or must we go down?
- World Energy Breakdown
The following image shows the world energy production/consumption breakdown.

Caption: "An attempt at showing world energy usage types with a bar graph." (2007).
Author: User: Omegatron.
Linked source: Wikipedia image http://en.wikipedia.org/wiki/File:World_energy_usage_width_chart.svg.
Use under GNU Free Documentation License.
You can see we are hopeless fossil fuel burners.
Well not hopeless, I hope.
But about as of 2004, as mentioned above, about 86 % of world primary energy production was from fossil fuels (WERC: Fossil Fuels).
Nuclear power and hydropower make significant, but modest contributions.
Biomass here, I think, means direct burning of wood and, probably a minute amount of feces.
The modern renewable energy sources are really, really minute---but growing rapidly.
Solar energy from photovoltaics is abysmally small---and yet it has the biggest potential of all.
The prosperity of the the 19th century and 20th century was to a large degree dug or pumped out of the ground as coal, oil, and natural gas.
What of the 21th century?
So far the answer is the same.
But we are still just at the beginning of this wild and woolly 21th century---but the 2010s are already about to pounce on us.
Are there enough fossil fuels to continue our current usage of them and double them if that is really what we need?
And is it safe to do so?
Global warming may impose costs on us for continuing a fossil fuel economy that we would find intolerable.
- Global Warming
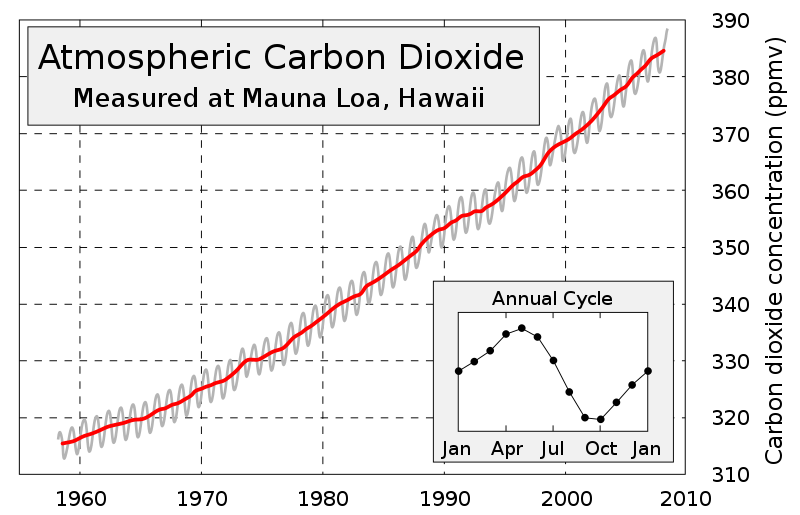
Caption: "This figure shows the history of atmospheric carbon dioxide concentrations as directly measured at Mauna Loa, Hawaii. This curve is known as the Keeling curve, and is an essential piece of evidence of the man-made increases in greenhouse gases that are believed to be the cause of global warming. The longest such record exists at Mauna Loa, but these measurements have been independently confirmed at many other sites around the world [1]. The annual fluctuation in carbon dioxide is caused by seasonal variations in carbon dioxide uptake by land plants. Since many more forests are concentrated in the Northern Hemisphere, more carbon dioxide is removed from the atmosphere during Northern Hemisphere summer than Southern Hemisphere summer. This annual cycle is shown in the inset figure by taking the average concentration for each month across all measured years."
Credit: User:S\351mhur in 2008.
Linked source: Wikipedia image http://en.wikipedia.org/wiki/Image:Mauna_Loa_Carbon_Dioxide-en.svg.
Use under GNU Free Documentation License.
We'll just briefly mention global warming since we've all hear of it and the 3rd module of this course cover it in detail.
It seems to be happening and driven by the human emissions of carbon dioxide and other greenhouse gases.
I personally follow the herd that thinks we have to stop greenhouse gas sooner rather than later to prevent the possibility of seriously negative/catastrophic climate change.
Caption: "A herd of goats on the road in the Greek highlands."
That's me at the far right with my head out of the picture.
Credit: User:AlMare
Linked source: Wikipedia image http://en.wikipedia.org/wiki/File:Herd_Of_Goats.jpg.
Permission: Public domain at least in USA.
And I'm hopeful.
Renewable energy production which we'll discuss below are currently a minute fraction of the energy production, but it is growing rapidly.
Exponential growth of renewable energy does seem to be happening.

Caption: Exponential growth is when the rate of increase of quantity is proportional to the amount of the quantity.
Red is linear growth: y = a*x
Blue is cubic growth: y = a* x**2
Green is exponential growth: y = a*e**x where irrational number---it's mad, bad, and dangerous to know.
Populations without some controling factor exhibit exponential growth.
There was a time long ago when bank accounts exhibited exponential growth.
Credit: User:Lunkwill and User:Kieff.
Linked source: Wikipedia image http://en.wikipedia.org/wiki/File:Exponential.png.
Permission: Public domain at least in USA.
A few percent increase every year and soon you have a lot.
A key sign of that growth is that US carbon emissions have decreased by 9 % over the last 2 years (On Energy, We're Finally Walking the Walk Lester R. Brown, 2009sep20, Washington Post.
Part of the decline must be due to the current/recent recession (Late 2000s Recession).
But it seems increasing efficiencies in energy use and growth in renewables must be playing a role.
Of course, the US seems to have lost the lead in carbon dioxide emissions to China.
But China is deeply into cleaner fuels too.
- Electric Energy: Mr. Versatile
We have no primary source of electric energy.
-
Electric energy to
be clearer should be called
electric field energy
because
electric energy
is the energy of the
electric field.
But electric energy is conventional.
But we have no practical way of using those.
So we have create electric energy from energy sources that we can access. And we overwhelmingly want to do that.
Electric energy is the most versatile of all commercial energy forms.
Electric energy can be easily created from other forms of energy, easily transported, and easily converted to other forms.
-
In fact, it's true to say that a lot of
electric energy
exists while in transportation.
Kinetic energy in an electric generator in power station creates an electric field that extends through electrical grid to end users who turn it into kinetic energy or heat energy or electromagnetic radiation or whatever.
So there's a constant flow of energy into the form of electric energy to sustain the electric field because there is a constant outflow trying to destroy it.
I don't know---and it's a hard thing to find out it seems---how much energy at any one time in electrical grid is in the form of electric energy.
Actually, one should say how much energy in the form electromagnetic field energy since magnetic fields are important in the transportation of electric energy too.
Someone knows I'm sure.
Almost entirely by using electric generators in power stations where kinetic energy is turned into electric energy.

Caption: "National Research Council (NRC) Image of Modern Steam Driven Turbine Generator".
Credit: US Federal Government
Linked source: Wikipedia image http://en.wikipedia.org/wiki/File:Modern_Steam_Turbine_Generator.jpg.
Permission: Public domain at least in USA.
What powers the electric generators?
In thermoelectric power stations burning coal or natural gas in heat engines (turbines to be precise) changes chemical energy into heat which is changed into kinetic energy which drives the electric generators.
In nuclear power stations, the heat from the nuclear fuel (i.e., nuclear energy of nuclei) is the power source.
-
One thinks of nuclear energy has modernistic, but all we want from it is
heat.
In windmills, it's the wind kinetic energy.
Only in photovoltaics is electric energy produced without an electric generator. Electromagnetic radiation energy is converted to electric energy by a materials property we won't go into.
So we can produce electric energy in a big way.
We can transport it in a big and efficient way with the electric grid---but improvements in the electric grid are needed.
Then at the end point we can use to do just about anything we can do with energy.
Electric motors can turn electric energy into kinetic energy.
Lighting can turn it into electromagnetic radiation energy.
Toasters and the like change it into heat.
We can turn it into chemical energy in electrical batteries.
Electric energy is so versatile and fills so many roles, that modern life would be totally different without it.
Electric energy has almost conquered all energy uses with two exceptions.
For heating, sometimes it's better (less costly) to use chemical energy directly.
But this is a minor, exception since we heat electrically if we wanted to and wanted to pay the extra cost.
The other exception is much more resistant to electrification.
That exception is the transport sector.
Until recently, storing electric energy either in electrical batteries (which is storage as chemical energy or some chemical fuel (which is also storage as chemical energy) of capacitors (which is storage as electric energy) has not been advantageous enough to lead to the electrification transport.
This is changing now as we know.

Caption: "Tesla Roadster Engineering Prototype at Yahoo!."
Tesla Roadster gets 393 kilometers per charge and accelerates from 0 to 60 mph in 3.9 seconds---apparently it's something like being in a rocket.
So if you have 100 K ...
Credit: User:fogcat5.
Linked source: Wikipedia image http://en.wikipedia.org/wiki/File:TeslaRoadster-front.jpg.
Permission: Licensed under the Creative Commons Attribution ShareAlike 2.5.
Why are electric cars possibly going to takeover.
There may be oil shortages as we'll discuss in the section Oil: The Long Goodbye.
So if oil runs short, any source of electric energy will help in the transport sector.
Also it's probably about twice as efficient to turn oil into electric energy in an efficient power station than to internal combustion engine car. (See Energy: Driving on Biomass by Ohlrogge et al. (2009).)
You would get twice as many miles per gallon.
Electric cars can also emit less carbon dioxide if the ultimate electric power source is less of an emitter overall.
But storing enough electric energy for electric cars is one thing.
Storing enough electric energy from intermittant renewables like solar power and wind power to satisfy needs of the electric grid at all times is a major challenge.
But there are ideas: e.g., compressed-air energy storage where you store energy as compressed in underground containers.

Caption: "Representation of the compressed-air energy storage concept".
You compress the air with electric energy and use the compresed air to power electric generators.
The concept is really simple. But is it the optimum choice?
This may be the way of the future or never---but on the other hand, it may be coming to a town near you soon.
Credit: US Department of Energy (DOE).
Linked source: Wikipedia image http://en.wikipedia.org/wiki/File:Minebw-large.jpg.
Permission: Public domain at least in USA.
Another idea is to use electrolysis to convert water (good old H2O) into O2 (which we throw away I guess) and H2 (molecular hydrogen) which we use as a fuel.
Storing H2 is storing energy.
Since it is a gas H2 has low energy density per unit volume like natural gas which is a drawback.
It has been projected that a whole hydrogen economy could be developed in which H2 would be the versatile stored energy while electric energy continued to be the versatile transportable, generatable, and end-use energy.
But there are criticisms of the hydrogen economy and it doesn't seem that it is likely anytime soon.
For more on electric energy storage and the smart grid, see Smart Grids: The Energy Storage Problem, David Lindley, (2010).
- Oil: The Long Goodbye
One's hears a lot nowadays about how long oil---in the sense of petroleum---will last.
The debate on the issue has actually gone on for decades.
It frequently seems to involve a whole lot of sneering at other people's predictions.
Obviously oil is a vital energy source---it's about 5 TW of the 16 TW of world power or 37 % of world power supply.
The biggest single energy source.
And it cannot be replaced in the transport sector overnight---maybe by next Tuesday.
And also a few per cent of oil also goes into making plastics.????
First, what is the oil world production/consumption trend?
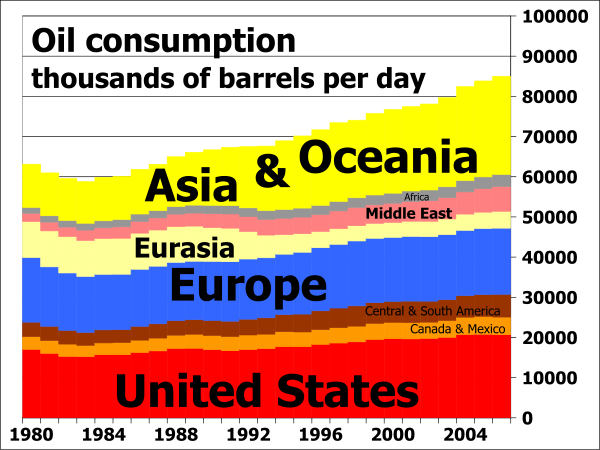
Caption: "Oil consumption in daily barrels per region from 1980 to 2006; vertical extents indicate barrels of oil consumed per day, and the horizontal scale shows years from 1980 to 2007".
As one can see most recent growth is in Asia and Oceania and a bit in the US.
Credit: User:84user
Linked source: Wikipedia image http://en.wikipedia.org/wiki/Image:Oil_consumption_per_day_by_region_from_1980_to_2006.svg.
Public domain.
Individual regions produce different amounts from consumption, but world production and consumption are about in balance.
There are really no vast accumulations in tanks.
But let's look at a longer perspective with some extreme predictions of world oil production/consumption.
Go to World Oil Production Forecast - Update May 2009 by Tony Eriksen.
I do NOT attest to Tony Eriksen's special authoritativeness, but he seems to be representative of the oil pessimists---those who think we are at or even beyond Peak Oil: the true worldwide maximum of oil production.
I can't show his images on my own page, because there's no permission.
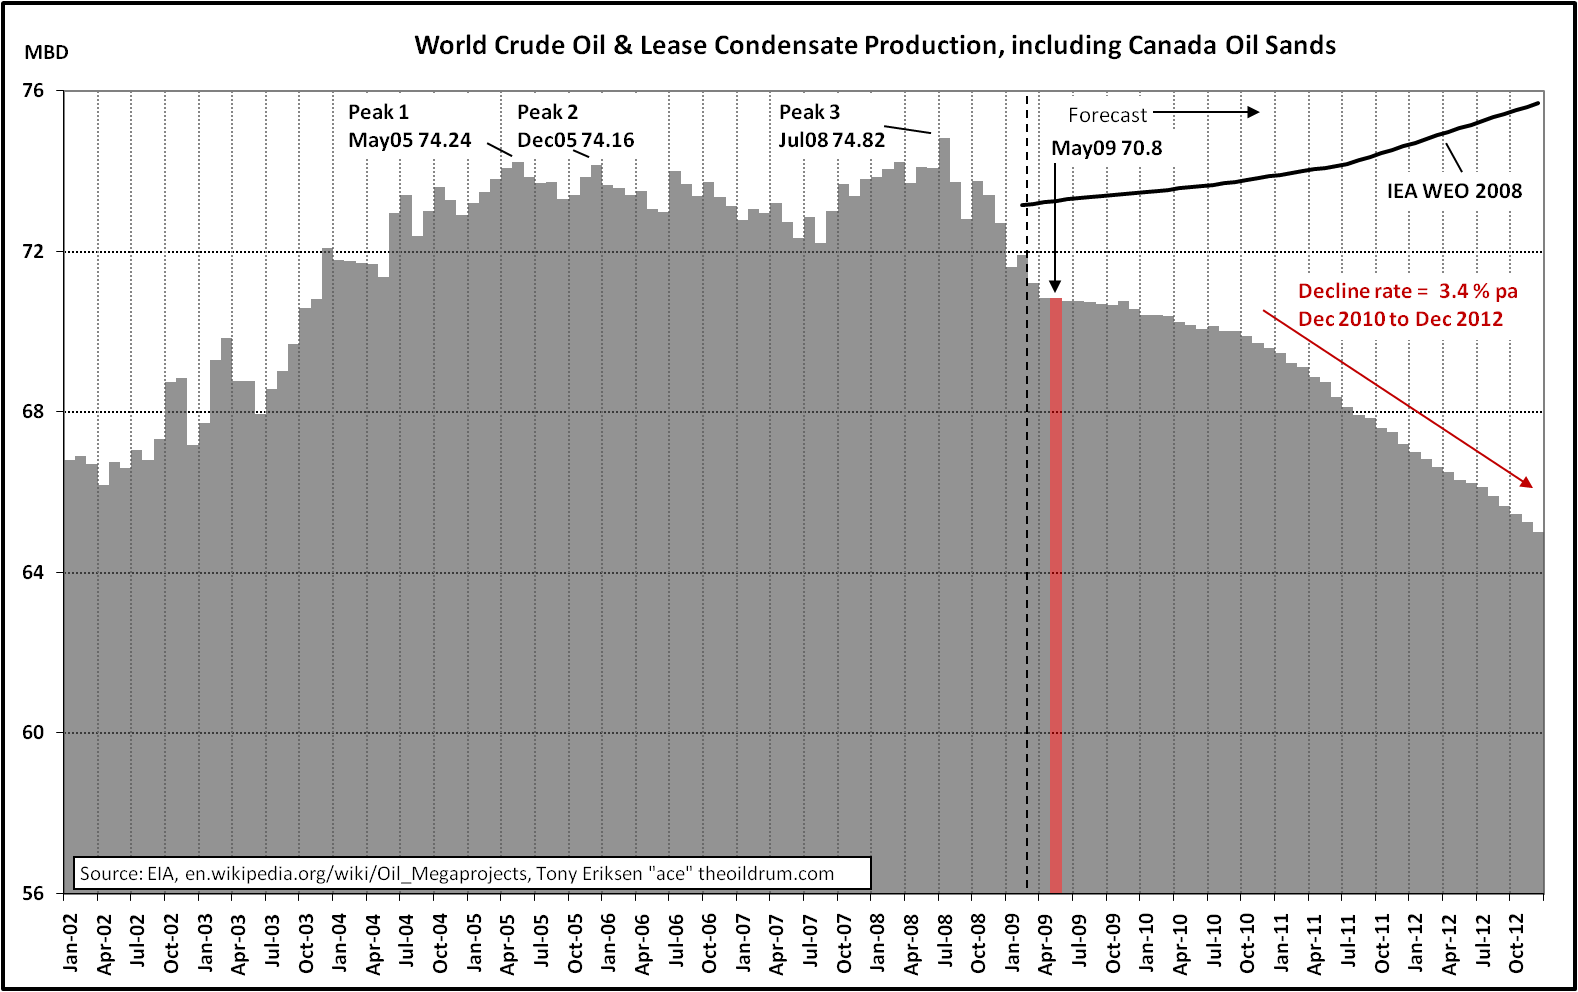
First consider this figure World Oil Production by Tony Eriksen
Note the amounts are MBD or megabarrels per day.
The historical data are based on data from Energy Information Agency (EIA) of the US Department of Energy.
We can assume they are reliable.
One can see oil production rose to about 2005jan.
This just follows the historical trend of rising oil production with a few dips since 1860 when largish commercial oil production started in Pennsylvania.???
Since 2005, there has been a bit of a plateau at about 74 MBD.
Is this plateau just a pause before oil production resumes growth that in a historical graph of the future will look like a minor phase?
Or is it Peak Oil with an irreversible final decline starting about now?
Eriksen is an oil pessimist and his prediction is that from 2008jul on is the final decline.
-
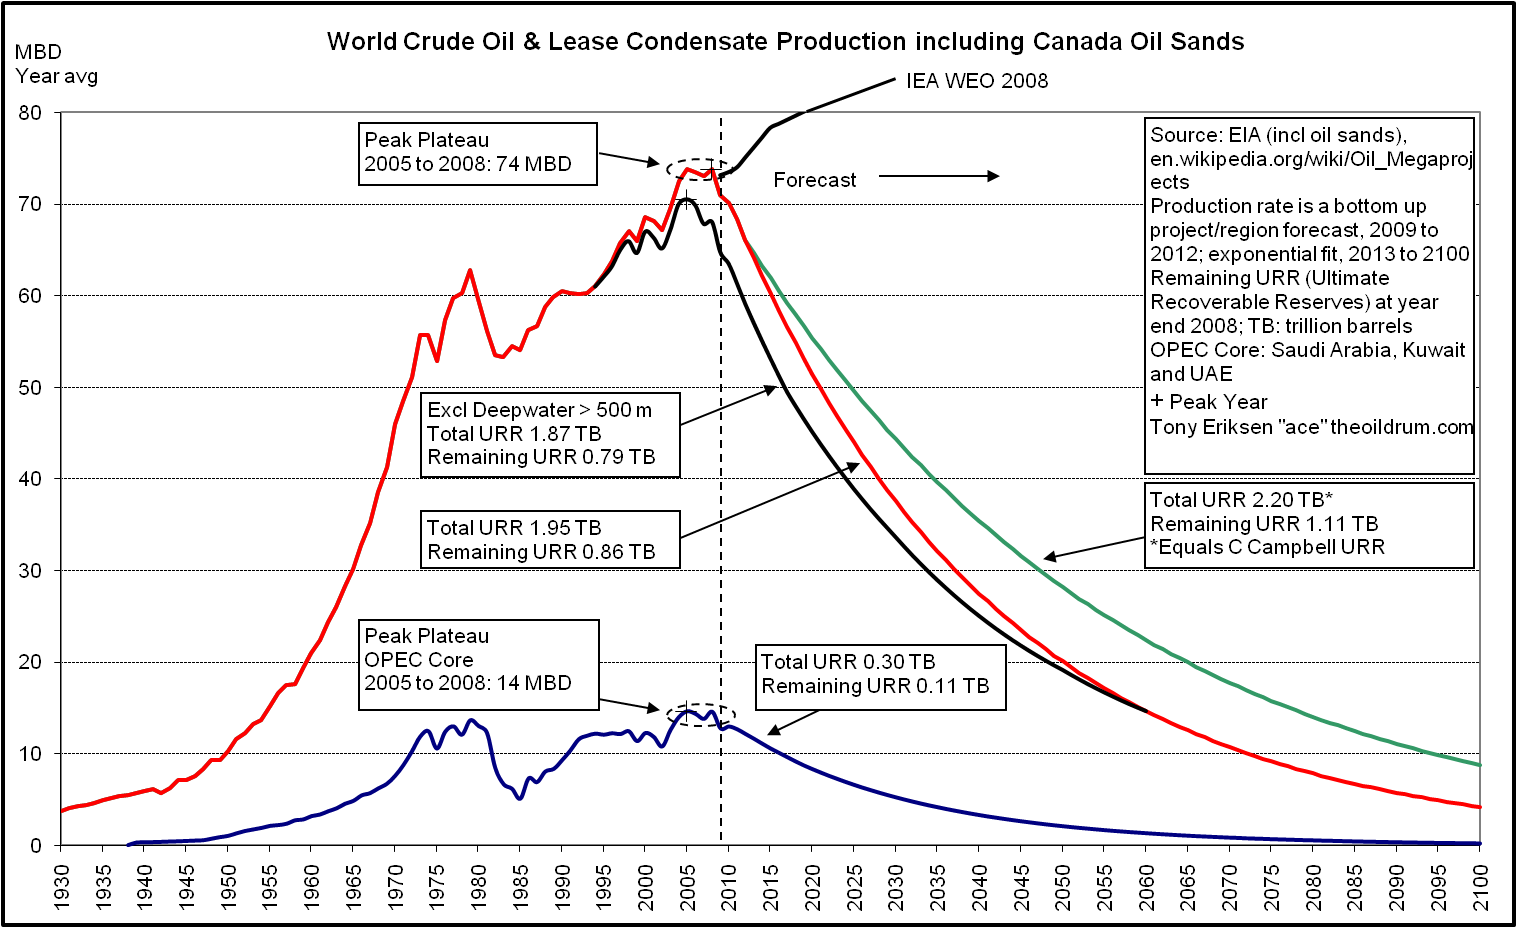
Here is Eriksen's long-range oil prediction:
World Oil Production to 2100.
But he also shows the International Energy Agency (IEA) which is an international organization which is sponsored by the Organisation for Economic Co-operation and Development (OECD) of which the US is a member.
IEA's prediction is representative of the oil optimists---oil production continues its historical growth.Who's right?
Well how could I know.
Remember the opinion of my guru Vaclav Smil: energy predictions are mostly wrong and right only by accident.
But let assume the pessimist and optimist curves in Eriksen's figure are extreme limits of the possible---even this may be wrong.
So anything in between is possible including wild oscillations up and down.
But what causes the big difference between pessimists and optimists.
Well I think it comes down to differences in whether technology will come through with ways to exploit old oil fields.
Oil in the ground is not in vast underground lakes. It's mixed in with porous rock.
When oil fields are first tapped, one often gets oil gushers.
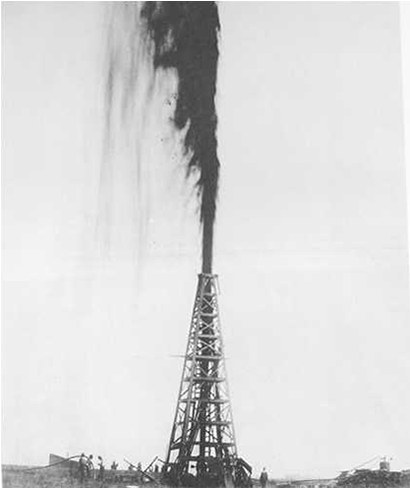
Caption: "The Lucas Gusher at Spindletop, Texas (1901)."
Those were the good old days when Texans could strike it rich.
Or Tennesseens: Ballad of Jed Clampett.
Credit: The American Petroleum Institute.
Linked source: Wikipedia image .
Permission: Public domain at least in USA.
In the oil gusher phase, oil is driven to the surface by natural underground pressure.
But typically after of order 15 % of the oil is recovered, the oil gusher phase is over.
Then you pump water or natural gas into the oil field to force out more oil.
With current technology, you may get up to 40 % of the oil with fluid injection.
The remaining 60 % or so is still in the ground.
So depleted oil fields are mainly thought to be depleted only with respect to our recovery means.
Oil pessimists think we will not develop cost effective means for further recovery.
Oil optimists like Leonardo Maugeri (vice-president of Italian oil company Eni) in his Scientific American article Another Century of Oil? Getting More from Current Reserves belive that cost effective means will be developed.
So it may be that we'll follow the pessimist path if the direct cost of extraction is too high relative to renewables say.
If it is not too high, we may have a choice.
But the indirect costs---i.e., the cost of global warming---may be too high.
But that would be societal deicision.
But how does society decide such things.
But here's a famous quote concerning world depletion of oil:
-
"The Stone Age didn't end because we ran out of stones" ---
Ahmed Zaki Yamani (1930--),
the Saudi Arabian Minister of Oil and Mineral Resources 1962--1986.
I don't know, but there are some negative signs?
-
Here is another Eriksen figure, but this is reliable data (I think) not prediction:
Mexico Cantarell Field Production Rate.
The Cantarell Field is Mexico's biggest oil field and one of the world's largest.
It's 80 km offshore in the Gulf of Mexico.
In 2004, it produced about 2.2 MBD which was more than 2 % of world oil production.
As of 2009jan, it's production was about 0.7 MBD which is still a lot of oil---about 1 % of the world oil production.
But Cantarell's production seems to be falling linearly and if that trend continues Cantarell may not produce any oil in 4 or 5 years.
Mexico hopes to revive Cantarell with new investment and advanced technology.
Time will have to tell.
Maybe other giant oil field's (like the world's largest Saudi Arabia's Ghawar Field generally considered the world's largest) will begin to fail soon.
Or maybe not.
- Old King Coal
One estimated R/P = 155 years ( http://en.wikipedia.org/wiki/World_energy_resources_and_consumption#Coal).
Remember the reserves-to-production ratio (R/P ratio) is a very fallible tool for prediction.
There are people who think Peak Coal may not be so far off. (See Does Economics Violate the Laws of Physics? by Nathanial Gronewold.)
Maybe a couple of decades.
- Natural Gas: The New King?
Just an estimate:
R/P = 15.7*10**21 J / 120*10**18 J/y = 1.3*10**2 = 130 y( http://en.wikipedia.org/wiki/World_energy_resources_and_consumption)Remember the reserves-to-production ratio (R/P ratio) is a very fallible tool for prediction.
- Nuclear: Renaissance, Relic, or Rogue?
If we used nuclear power for all our current energy usage one can estimate R/P ratios:
- With once-through reactors:
R/P = 17*10**21 J / 500*10**18 J/y = 34 yThis is not enough. - With breeder reactors:
R/P = 1*10**24 J / 500*10**18 J/y = 2*10**3 = 2000 yThis is plenty, but breeder reactors produce bomb-grade plutonium which presents a significant risk if every country in the world uses them.
Actually the technology to get the maximum yield from breeder reactors does NOT yet exist.
So the 2000 year estimate may be wildly optimistic.
Nuclear power that there is very little carbon emission using it.
But is it really cost effective compared to renewables?
There's a big argument about that.
I've no idea.
But one big drawback with nuclear power is that it takes about 10 years or more to plan and build a nuclear power station---at least the way we do thing nowadays.
Vastly increasing our nuclear power would probably require decades.
- Biofuels or Bust?
The total dry biomass energy per year is only 1800 EJ.
We use 500 EJ/y of energy and may want to use 1000 EJ/y.
Humanity already effectively uses up of order 600 EJ of biomass energy per year---mostly not for fuel, but for food and other land uses.
It seems impossible that any significant portion of the remaining 1200 EJ can be used without intolerable damage to the biosphere.
The numbers above are all from Smil 2003, p. 264--265 and, of course, are uncertain to some degree.
Even allowing for considerable uncertainty, biofuels as major source of world energy seems very unlikely.
They can play a role in the US and in Brazil. Few other countries have ecosystem to spare.
Maybe biofuels from the oceans will big, but I have no idea.
Biofuels may play a major role in certain uses: e.g., maybe aviation fuel.
- Solar Power: The Afternoon of Humanity?
The total solar power is about 5500 times the total commercial power consumption of humankind.
Behold:
(89000 TW)/(16 TW) = approximately (90/16)*10**3 = 5500.
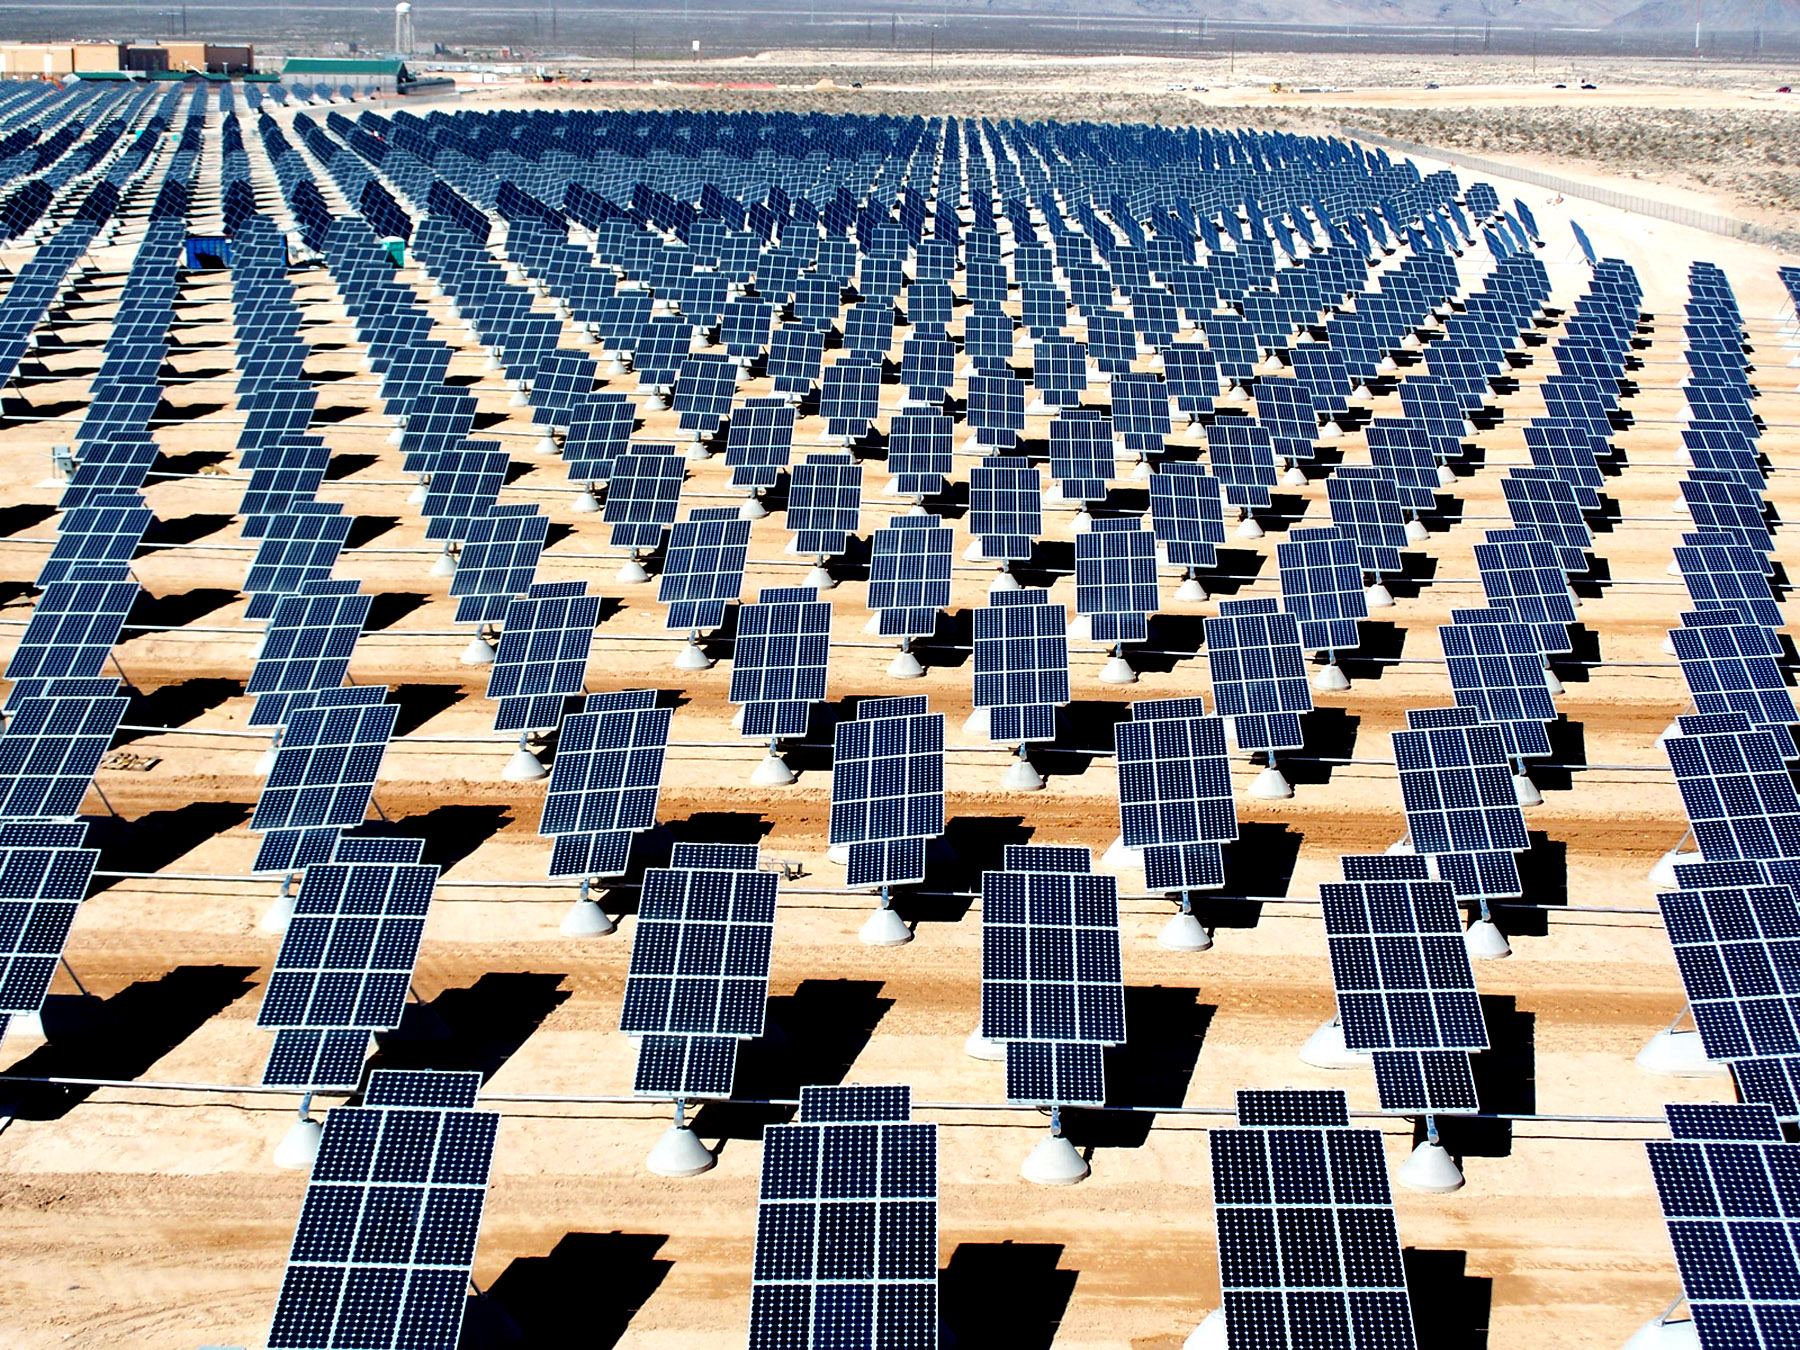
Caption: "On 140 acres of unused land on Nellis Air Force Base, Nev., 70,000 solar panels are part of a solar photovoltaic array that will generate 15 megawatts of solar power for the base." (2007dec)
Credit: U.S. Air Force photo/Airman 1st Class Nadine Y. Barclay.
Linked source: Wikipedia image http://en.wikipedia.org/wiki/Image:Giant_photovoltaic_array.jpg.
Public domain.
Solar power is big, eternal, intermittent, and turns off at night.
There is a Solar Power Grand Plan Zweibel et al. 2008, Scientific American, January, p. 64.
The plan is to make solar power the dominant power in the US by 2050.
By why not the world and have a SuperGrid to transmit the power wherever it is needed?
Solar and wind power are intermittent---but if you could transmit them world wind, intermittency could be cured: ``It's always daylight somewhere in world.''---Dracula

Caption: "Nosferatu Promotionphoto".
Credit: Creators of the film Nosferatu. Uploaded by User: Bartholome.
Linked source: Wikipedia image http://en.wikipedia.org/wiki/Image:Schreck.jpg.
Public domain at least in USA.
There is a grander plan to make solar and wind power supply all the world's energy needs by 2030. (See A Plan to Power 100 Percent of the Planet with Renewables by Mark Z. Jacobson and Mark A. Delucchi---the two Marks).
- Abrupt Sign-off
I can only say with Groucho Marx: Hello, I Must be Going.


