

Caption: A schematic Hertzsprung-Russell (HR) diagram.
Credit/Permission: © User:Rursus, 2007 / Creative Commons CC BY-SA 3.0.
Image linked to Wikipedia.
Supplementary Lab Preparation: The items are often alternatives to the required preparation.
The quiz might be omitted if it's not feasible or convenient. The students may or may not be informed ahead of time of quiz omission depending on the circumstances.
The quizzes in total are 40 % of the course grade. However, only the top five quiz marks are counted.

Caption: St. Nestor the Chronicler (c. 1056--c. 1114), St. Vladimir's Cathedral, Kiev, Ukraine.
At his studies.
Credit/Permission: Viktor Vasnetsov (1848--1926), 1919 (uploaded to Wikipedia by User:Butko, 2006) / Public domain.
Image linked to Wikipedia.
In preparing for a quiz, go over the Required Lab Preparation.
The Supplementary Lab Preparation (see above) could help, but is only suggested if you feel you need more than the required Required Lab Preparation.
There is no end to the studying you can do, but it is only a short quiz.
One to two hours prep should suffice.
There will be 10 or so questions and the time will be 10 or so minutes.
The questions will range from quite easy to challenging.
The solutions might be posted at Starlight: Quiz Solutions after the quiz is given. Whether they are or not depends on the circumstances of each individual semester.

Caption: Plato (428/427--348/347 BCE) and Socrates (circa 469--399 BCE) in a Medieval image.
Here the disciple seems to be instructing the master/mentor using the Socratic method.
The basic pose is much like in intro labs.
Credit/Permission: Medieval artist, Middle Ages (probably 1000--1400) (uploaded to Wikipedia by User:Tomisti, 2007) / Public domain.
Image linked to Wikipedia.
In case the weather is not good for observing, you need to have an alternate indoor lab ready. In the first instance, you should do inside lab from some other date in the lab schedule. However, if all inside labs from the lab schedule have been done, then you can select something else from the Catalog of Introductory Astronomy Labs. If it has not already been done, one suggestion is Hubble's Law. It is pretty easy, and so is a quick prep for instructor and students.
Usually, the Universal Time (UT) of observing will be the local calendar date plus one day at 4 or 5 am:
Date and time: ,
See Telescope Operating Procedure and List of Tricks for C8 Telescopes.

Caption: "Red foxes (Vulpes vulpes) at the British Wildlife Centre, Horne, Surrey, England." (Slightly edited.)
Credit/Permission: © Keven Law, 2008 / Creative Commons CC BY-SA 2.0.
Image linked to Wikipedia.
We also learn about Hertzsprung-Russell (HR) diagram which exhibits the luminosity-temperature relationship of stars in a scatter diagram.
We also get more practice with the telescope---to be specific, with our C8 telescopes.
The specified Required Preparation should have covered everything.
But we will skate quickly over everything until we've had enough.
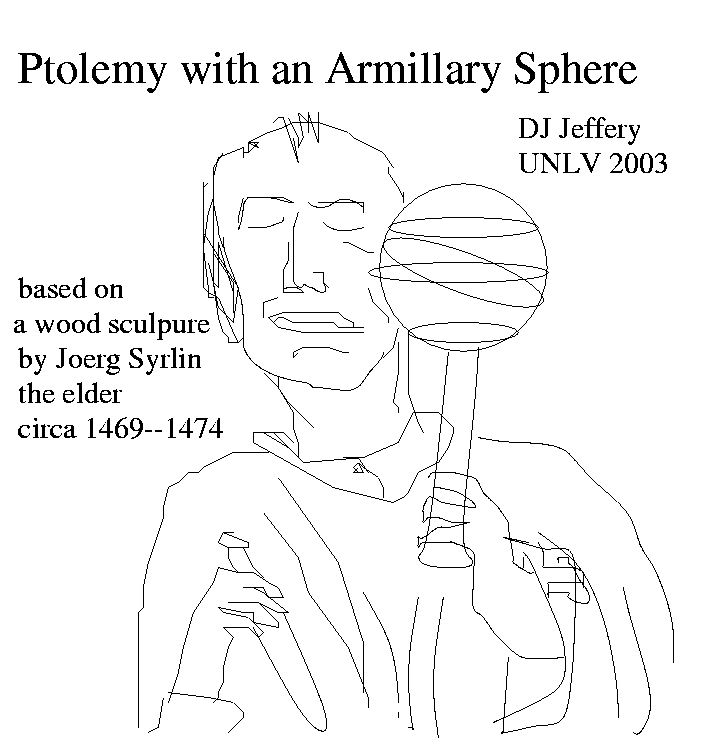
Caption: Ptolemy (c. 90--c. 168 CE) with an armillary sphere.
The early historical magnitude system work was all by naked-eye astronomy and just by comparing stars in a semi-quantitative fashion.
Unfortunately, the magnitude scale runs the WRONG way.
Dimmer stars have larger magnitudes.
This is a source of endless confusion---the dead hand of the past prevails in astronomy, the oldest empirical science
The study of star flux and luminosity using the magnitude system is called photometry.
The relationship is logarithmic.
For our purposes, we only need to say that 1 magnitude difference corresponds to a factor of approximately 2.512 difference in flux and 5 magnitude difference to a factor of exactly 100 in flux.
But remember the magnitude scale goes the WRONG way.
So 1 mag more, means 1/2.512 times dimmer in flux.
And 5 mag more, means 1/100 times dimmer in flux.
In my shorthand, magnitude goes up implying flux goes down is written M ↑ f ↓.
And, of course, with quantitative detectors, magnitudes are not confined to being integers.
So a magnitude can be any real number---negative real numbers for negative magnitudes.
Stars of negative magnitude are for brighter objects than any positive or zero magnitude---which is brighter than any object with a positive magnitude.
Confusing isn't it.
So apparent magnitude or brightness depends on the luminosity in some wavelength bands (i.e., energy output per unit time in some wavelength bands) of the object and on its distance.
Just as the apparent brightness of an incandescent light bulb depends on its power rating and how far you are from it.

Caption: Thomas Edison (1847--1931) with incandescent light bulb.
There were many people involved in the invention and diffusion of the incandescent light bulb. Thomas Edison was the key figure in making incandescent light bulb practical.
Credit/Permission: Anonymous photographer, circa 1920? (uploaded to Wikipedia by User:Head in 2010) / Public domain.
Image linked to Wikipedia.
In both cases, the farther the observer, the dimmer the object.
In my shorthand: r (distance) ↑ f ↓ M ↑.
The actual flux-distance formula (in the absence of extinction by interstellar dust) is
              f_b=L_b/(4πr**2)  ,

                where f_b is flux in some
                  wavelength band b
                and L_b is power output (energy per unit time or
                   luminosity) in
                  wavelength band b.
The flux-distance formula is an inverse-square law: flux falls off as 1 over distance squared.
Thus, absolute magnitude is a measure of luminosity and can be converted to luminosity with the relevant formula.
You can never measure the whole electromagnetic spectrum at once. Really only small parts of it can be measured at once time.

Caption: A diagram illustrating the electromagnetic spectrum in multiple ways.
Note
   wavelength = c / frequency

   where c is the vacuum light speed.
Thus, wavelength and frequency contain the same information in a different form.
Credit/Permission: © User:Inductiveload, 2007 / Creative Commons CC BY-SA 3.0.
Image linked to Wikipedia.

Caption: A schematic diagram of the psychophysical luminosity function of the average human eye.
You cannot usually measure the total electromagnetic spectrum of an object.
There are standard wavelength bands bands or, as they are called, standard magnitudes.
The most standard ones are UBVRI.
U stands for ultraviolet and measures flux in what is roughly the near ultraviolet (300--400 nm).
B stands for blue and corresponds to the what humans see as blue light.
V stands for visual and corresponds to the what humans see as yellow light, more or less.
R stands for red and corresponds to the what humans see as red light.
I stands for infrared and measures flux in what is roughly the short wavelength end of the near infrared (750--1400 nm).

Caption: The electromagnetic spectrum.
Note
  wavelength = c / frequency

  where c is the vacuum light speed.
Thus, wavelength and frequency contain the same information in a different form.
Credit/Permission: © Philip Ronan / Creative Commons CC BY-SA 3.0.
Image linked to Wikipedia.
The UBVRI passbands are illustrated below.
Caption: The UBVRI passbands of photometry.
Here is a table specifying the wavelength bands of the UBVRI passband system.
_________________________________________________________________________________________________________

Table:  UBVRI Passband System
_________________________________________________________________________________________________________

   Band        λ          Δλ            Comment
           (microns)   (microns)
_________________________________________________________________________________________________________

     U       0.36        0.15           U stands for ultraviolet.
     B       0.44        0.22           B stands for blue.
     V       0.55        0.16           V stands for visual, but Y for yellow would have made more sense.
     R       0.64        0.23           R stands for red.
     I       0.79        0.19           I stands for infrared.
____________________________________________________________________________________
Reference: The data are from Wikipedia: Apparent magnitude: UBVRI.
The wavelength λ is the mean band wavelength.
The Δλ is the characteristic width of the wavelength bands The bands have a wavelength-varying response to intensity.
_________________________________________________________________________________________________________
Credit/Permission: © Michael Richmond, circa 2000s / Creative Commons CC BY-SA 2.0.
Image linked to Michael Richmond: Photometric systems and colors.
The zero point of the V scale is Vega for the table.
_____________________________________________________________________________________

Table:  Approximate number of Stars brighter than or equal to V as a function of V
_____________________________________________________________________________________

    V     Apparent brightness     Number of stars    Naked-eye stars
            relative to Vega     brighter than/= V
                  (%)
_____________________________________________________________________________________

   -1.0        250                        1               yes
    0.0        100                        4               yes
    1.0         40                       15               yes
    2.0         16                       48               yes
    3.0          6.3                    171               yes
    4.0          2.5                    513               yes
    5.0          1.0                   1602               yes
    6.0          0.40                  4800               yes
    7.0          0.16                 14000               no
    8.0          0.063                42000               no
    9.0          0.025               121000               no
   10.0          0.010               340000               no
_____________________________________________________________________________________
Reference: The data are from Wikipedia: Apparent magnitude: History.
The numbers may actually be exact down to V=5. To know for sure, one would have to do a detailed check.
_________________________________________________________________________________________________________
A color is the difference between two standard magnitudes.
The most standard color is B-V which is just the B magnitude minus V magnitude
Because magnitude run the WRONG way, B-V increasing means redder color and colder temperature.
Remember the sequence of colors for heated objects: red hot, orange hot, white hot, blue hot.
The more blue light a star produces relative to yellow light, the hotter it is.
But since the magnitude scale runs the WRONG way, so does the color scale.
The smaller B-V, the higher the temperature.
We will not go into the formula relating B-V and temperature. It's tricky.
The diagram below illustrates how blackbody spectra (which are similar to continuous spectrum part of stellar spectra) vary with temperature and therefore with B-V color.

Caption: Intensity Blackbody spectra for Kelvin temperatures 3000 K, 4000 K, and 5000 K.
The classical Rayleigh-Jeans law for T=5000 K is also shown.
Rayleigh-Jeans law asymptotically agrees with the correct blackbody spectrum in the limit that wavelength λ goes to infinity but as λ goes to zero, the Rayleigh-Jeans law predicts infinite energy---this is the famous ultraviolect catastrophe---which was a clue that classical physics failed outside of what we now call the classical realm.
Note plot illustrates that as temperature increases/decreases the spectra become bluer/redder (more dominated by blue/red light).
You should also remember that blue hot is hotter than white hot is hotter than red hot---is there a green hot?
In astronomy, star temperature is often measured by the color index (AKA color) B-V.
The color is the difference between B and V magnitude.
In shorthand, the sense of the variation with B-V is B-V ↑ reddness ↑ temperature ↓.
It seems weird that temperature decreases as B-V increases, but that's the wrong-way magnitude system for you.
Credit/Permission: User:Drphysics, 2007 / Public domain.
Image linked to Wikipedia.
Caption: A schematic Hertzsprung-Russell (HR) diagram with color index (AKA color) B-V spectral type, along the horizontal axes and absolute magnitude in V. along the vertical axis.
Absolute magnitude in V is a proxy for luminosity (total power integrated over all wavelength).
The bands on the diagram of the luminosity classes are:
Credit/Permission: © User:Rursus, 2007 / Creative Commons CC BY-SA 3.0.
Image linked to Wikipedia.
Now for a real Hertzsprung-Russell diagram which illustrates the relationship between star color index (AKA color) B-V / spectral type / stellar photosphere temperature and luminosity in units of solar luminosity

Caption: A real Hertzsprung-Russell (HR) diagram.
In this version of an HR diagram, luminosity (in units of solar luminosity) / absolute magnitude are plotted versus color index (AKA color) B-V / spectral type / stellar photosphere temperature.
The high-temperature blue-white stars are on the left and the low-temperature red stars on the right.
The diagram is a plot of 22000 stars from the Hipparcos Catalogue plus with 1000 low-luminosity stars (red dwarfs and white dwarf) from the Gliese Catalogue of Nearby Stars.
Ordinary hydrogen-burning stars (e.g., the Sun) are found in a band running from top-left to bottom-right called the main sequence.
Giant stars form a group on the upper-right side of the diagram. Above them lie the much rarer bright giants and supergiants.
Below the main sequence is the band of the white dwarfs---these are the cores of old stars no longer have nuclear burning and over billions of years cool slowly moving towards the bottom-right of the diagram.
Credit/Permission: © Richard Powell, 2007 / Creative Commons CC BY-SA 2.5.
Image linked to Wikipedia.
The Hertzsprung-Russell (HR) diagram illustrated dynamically by an applet below.
You could just search by name in Wikipedia or search for the name in the Wikipedia: List of Brightest Stars which gives apparent V magnitude and stellar classification, but, alas, not color.
Often bright stars are multiple-star systems. Just take the first magnitude and color in the line for those quantities---the first ones are for the brightest star in the multiple-star systems.
Some stars may not be in Wikipedia.
The Observer's Handbooks are on the shelves in the lab room.
The brightest stars are ordered by increasing right ascension (RA) and are identified by their Bayer designation.
The stars in a given constellation will be relative close together in the table, but they will not be contiguous, in general.
Yours truly belongs to Canadian Astronomical Society/Societe Canadienne d'Astronomie (CASCA), who are the professionals.
Choose only named stars and NOT ones that are just SAO stars---it seems very difficult make the telescope control accept them.
You need to choose a largish range of V magnitudes and color.
But do NOT choose anything to faint. Say nothing fainter than V=4.
You use the pad on a C8 to select a star and the C8 will slew to the star automatically.
The Telescope Tricks will help you use the pad.
Pretty much all the stars will be under NAMED STARS on the pad.
The Pleiades stars will NOT be under NAMED STARS in general, but the Pleiades will be under NAMED OBJECTS.
The alignment of the telescope will NOT be perfect.
The star will probably be in the field of view of the finderscope, but NOT generally in the field of view of the main telescope.
You will probably have to center the star on the crosshairs of the finderscope to find it in the field of view of the main telescope.
To do the centering, a slew rate of 5 is probably good. Revert to a slew rate of 9 for finding the next star.
The sky maps will help.
You should be able to find all the bright stars for the apppropriate season if the sky is clear.
        ________________________________________________________

        Table:   Bright Stars for the Observing Working Table
        ________________________________________________________

        Summer and Fall Stars
        ________________________________________________________

        Common Name   Bayer Designation  SAO No.   Comment
        ________________________________________________________
        Altair        α AQL              125122
        Antares       α SCO              184415
        Arcturus      α BOO              64589
        Capella       α AUR              40186
        Caph          β CAS              21133
        Deneb         α CYG              49941
        Mizar         ζ UMA              28737
        Polaris       α UMI              308
        Sadr          γ CYG              49528
        Sheliak       β LYR              67451
        Rasalgethi    α HER              102680
        Tarazed       γ AQL              105223
        Vega          α LYR              67174
        ________________________________________________________

        Winter and Spring Stars
        ________________________________________________________

        Common Name   Bayer Designation  SAO No.   Comment
        ________________________________________________________
        Aldebaran     α TAU              94027
        Betelgeuse    α ORI              113271
        Capella       α AUR              40186
        Caph          β CAS              21133
        Castor        α GEM              60198
        Polaris       α UMI              308
        Pollux        β GEM              79666
        Procyon       α CMI              115756
        Rigel         β ORI              131907
        Sirius        α CMA              151881

           Stars in Pleiades  (an open star cluster)
             in order of apparent magnitude in V.

        Alcyone       η TAU
        Atlas         27 TAU
        Electra       17 TAU
        Maia          20 TAU
        Merope        23 TAU
        ________________________________________________________
To see where the constellations for tabled stars are currently click Sky map: Las Vegas, current time or see just below.
The Pleiades are on the sky map just a bit north west of the Taurus outline---they are actually in Taurus
You can zoom in on the Pleiades.
Just print the image below to be your finder chart for the Pleiades.

Caption: An HST image of the Pleiades an open star cluster, in Taurus centered about 127 pc away and spanning about 13 pc.
The round and pointed stars are finite in size because of finite resolution of the imaging system. They are actually unresolved.
The points are due to star diffraction patterns in the imaging system. The overexposure of the stars brings out the diffraction pattern.
The Pleiades stars themselves have a bluish glow around them because their light is being reflected from clouds interstellar dust. Such reflecting clouds are called reflection nebulae.
The bluish glow is actually rather faint and a long exposure was needed to bring it out. This, of course, means that the stars got overexposed.
The 9 brightest Pleiades are named in the image. The Pleiades has about 1000 known members, but this number does not include unresolved binaries (see Wikipedia: Pleiades: Composition).
The 9 brightest Pleiades are probably the only ones that are naked eye stars---but how many are seen depends on viewing conditions and the observer's scotopic vision.
Credit/Permission: NASA, ESA, and AURA/Caltech, 2004 / Public domain.
Image linked to Wikipedia.
You need to estimate brightness: very bright, bright, medium, faint, very faint. This is a relative judgment after you've got some experience.
Blue, white, yellow, orange, red is in order of increasing redness as measured by astronomical color which increases with redness.
Judging ordinary color is really hard. Try your best. Some people have better eyes for it than others.
Get going on Part B 2b, and 2c.
I've already chose the bright stars for Part B 2a for you.
Part B, 1 can wait until after the observing.

If they do give the astronomical definition, it is often incomplete or says things that are true, but do not really define the term.
It is best to get definitions of astronomical terms from astronomy sites.
Wikipedia is usually good.
Do not give any non-astronomical definitions.
Caption: Film poster for the TheMummy (1932) starring Boris Karloff (1887--1969).
Credit/Permission: Employee or employees of Universal Pictures attributed to Karoly Grosz (fl. 1930s), 1932 (uploaded to Wikipedia by User:Crisco 1492, 2012) / Public domain.
Image linked to Wikipedia.
But if you do, make sure their answers are correct and that you have correctly copied them.
Mindlessly copied answers frequently lack key words or have words changed accidentally.