 Cartoon of a Hertzsprung-Russell (HR) diagram with stars
(not accurate)
(FK-428).
Cartoon of a Hertzsprung-Russell (HR) diagram with stars
(not accurate)
(FK-428).
 Cartoon of a Hertzsprung-Russell (HR) diagram with radius contours
(not accurate)
(FK-428).
Cartoon of a Hertzsprung-Russell (HR) diagram with radius contours
(not accurate)
(FK-428).
 Cartoon of a Hertzsprung-Russell (HR) diagram with radius contours
(not accurate)
(FK-430).
Cartoon of a Hertzsprung-Russell (HR) diagram with radius contours
(not accurate)
(FK-430).
 Cartoon of a Hertzsprung-Russell (HR) diagram with
main sequence star masses (not accurate)
(FK-433).
Cartoon of a Hertzsprung-Russell (HR) diagram with
main sequence star masses (not accurate)
(FK-433).
 Cartoon of the
mass-luminosity relation
for main sequence stars
(not accurate).
Cartoon of the
mass-luminosity relation
for main sequence stars
(not accurate).
 Cartoon of the pre-main-sequence evolution of stars on the HR diagram
(not accurate)
(HI-338).
Cartoon of the pre-main-sequence evolution of stars on the HR diagram
(not accurate)
(HI-338).
 Cartoon of star frequency in the solar neighborhood
(not accurate)
(HI-330--331,339).
Cartoon of star frequency in the solar neighborhood
(not accurate)
(HI-330--331,339).
 Binaries and binary orbits
(FK-435).
Binaries and binary orbits
(FK-435).
 Atomic spectra for stellar spectroscopic analysis.
An Angstrom is 10**(-10) meters. It is a non-standard unit, but often used by spectroscopists.
The upper spectra are spectra for actual stars. The lower spectra are just the spectra of particular atoms. One uses the lower spectra to identify the atoms in the upper spectra.
Hydrogen offers the simplest emission line spectrum: a red line, a blue-green line, a blue line, and a violet line.
The hydrogen red line at 6563 Angstroms (656 nm) is usually the strongest visible line of hydrogen. Hot interstellar gas often emits this line which gives true color pictures of such gas a reddish or pinkish color.
Halpha and the sodium doublet can both be identified in the star A spectrum.
Credit: NASA: Imagine the Universe.
 Making an absorption line spectrum.
The atoms, ions, and molecules immediately above the photosphere are colder than the photosphere. They will absorb the photospheric emission in their lines.
Credit: NASA: Imagine the Universe.
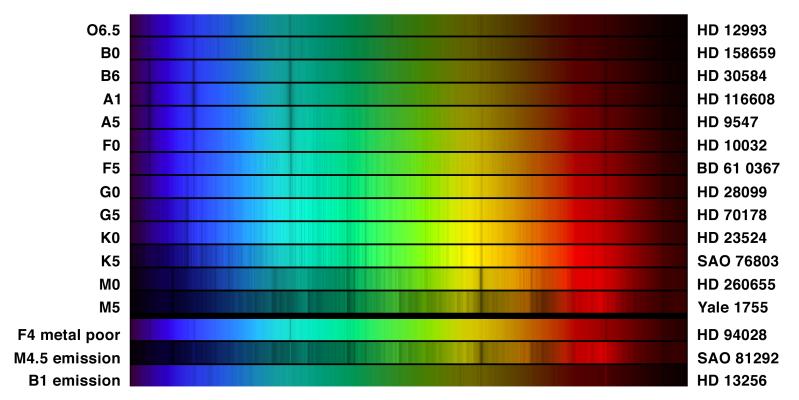 Star spectra for the visual range 400--700 nm.
The 13 top spectra show regular spectral types from the OBAFGKM SEQUENCE: temperature decreases top to bottom.
The bottom three spectra are special types.
The hydrogen Balmer lines (i.e., the visual band hydrogen lines) are strongest in absorption for A0--A5 stars which have photosphere temperatures of order 9000 K (FK-424).
In the image the blue-green Hbeta (486.132 nm) and violet-blue Hgamma (434.046 nm) absorption lines are quite apparent on and about the A1 spectrum (FK-423).
The red Halpha (656.280 nm) is somewhat darkened out for the A1 region, but can still be made out (FK-423).
The Na I doublet (588.995, 589.592 nm) in the yellow is quite noticeable for the M0 and M5 stars (FK-423).
As we know from Wien's law, the maximum of a blackbody spectrum should shift to the red as temperature decreases.
This is apparently shown in this figure since bright zone forms a broad diagonal from upper right to lower left.
But since colors in images can be easily manipulated, it is hard to know if we are really seeing this effect.
Credit: NOAO/AURA/NSF.
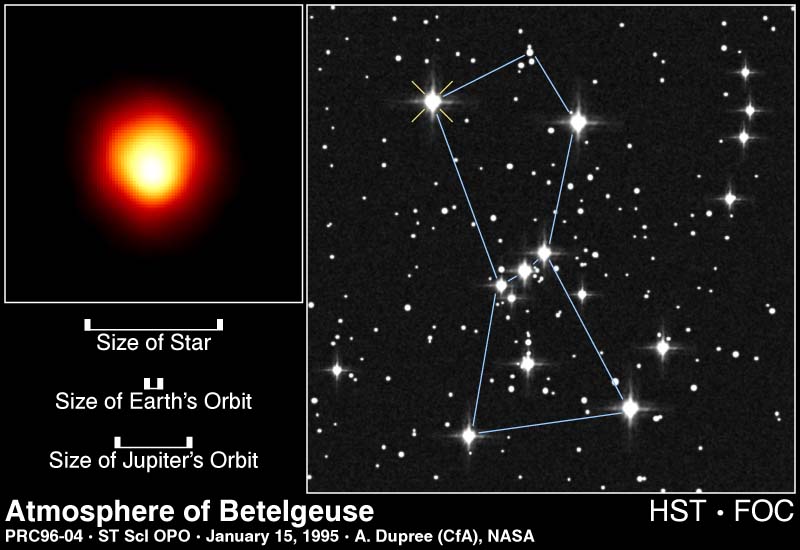 Betelgeuse imagined by the HST.
Betelgeuse is an M1 Iab red supergiant star. It is 131 pc from Earth.
It is the eastern shoulder of Orion: i.e., the left shoulder on the image.
Orion is, of course, a giant hunter of Greek mythology: he pursued the Pleiades and was slain by Artemis (Ba-855).
The lines joining the stars are NOT present on the sky, of course.
Orion is one of the three constellations anyone can recognize: the other two are the Big Dipper (officially an asterism in Ursa Major) and Cassiopeia (the big W): both are in the northern sky and are all-year constellations.
Credit: NASA/HST.
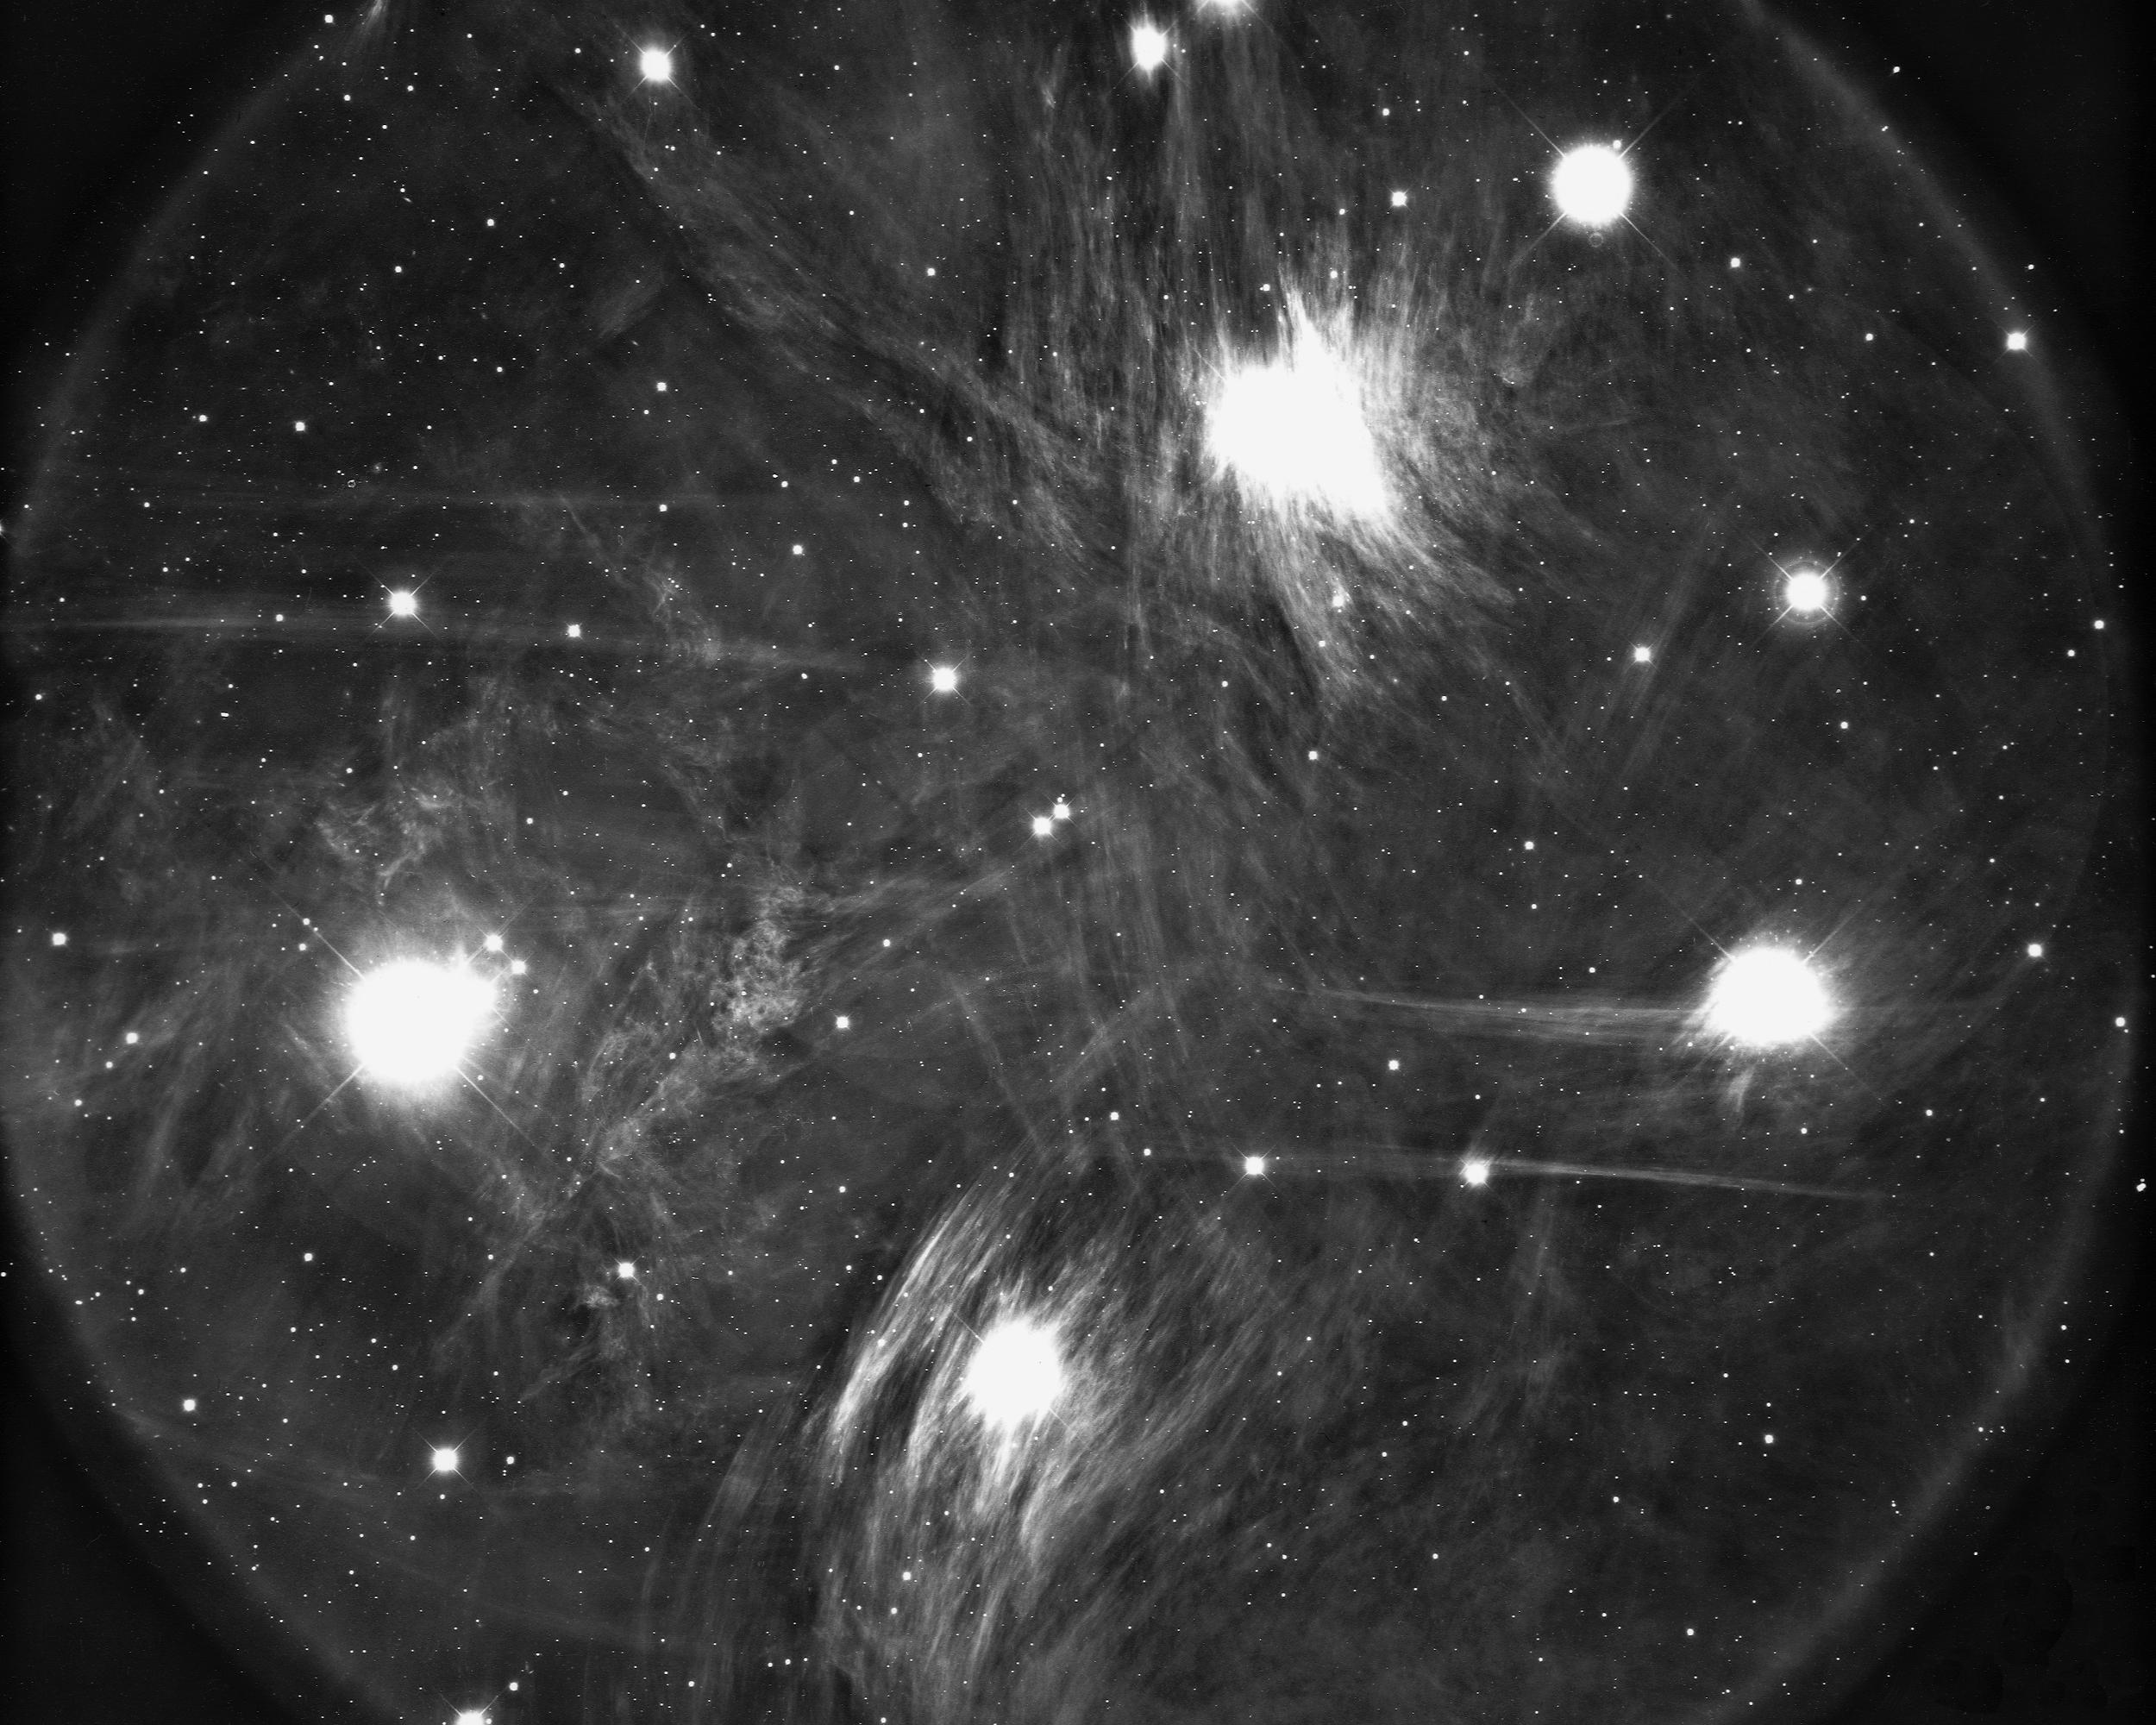
The Pleiades, an open star cluster, in Taurus centered about 127 pc away and spanning about 13 pc.
The stars in this image are really unresolved point sources.
The round and pointed stars are finite in size because of finite resolution of the imaging system.
The Pleiades stars themselves have a glow around them because their light is being reflected from interstellar dust.
Credit: NOAO/AURA/NSF.
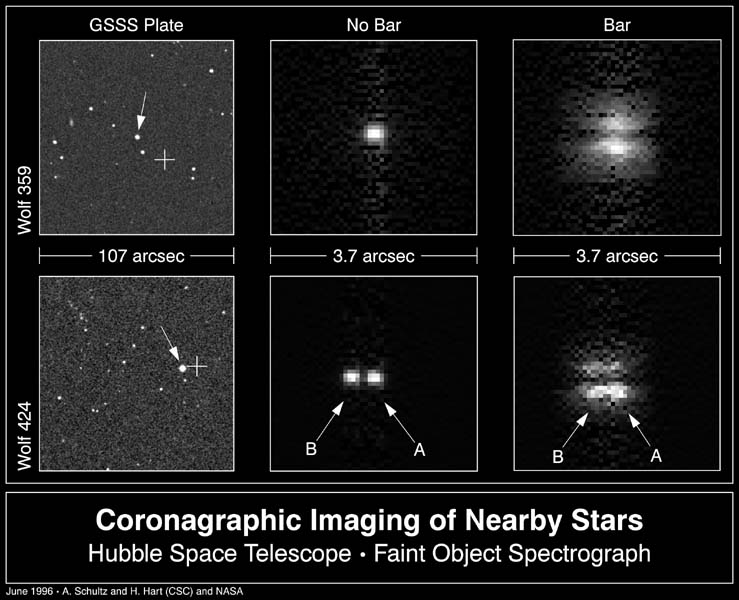 Coronographic imagining of nearby stars.
Credit: NASA/HST
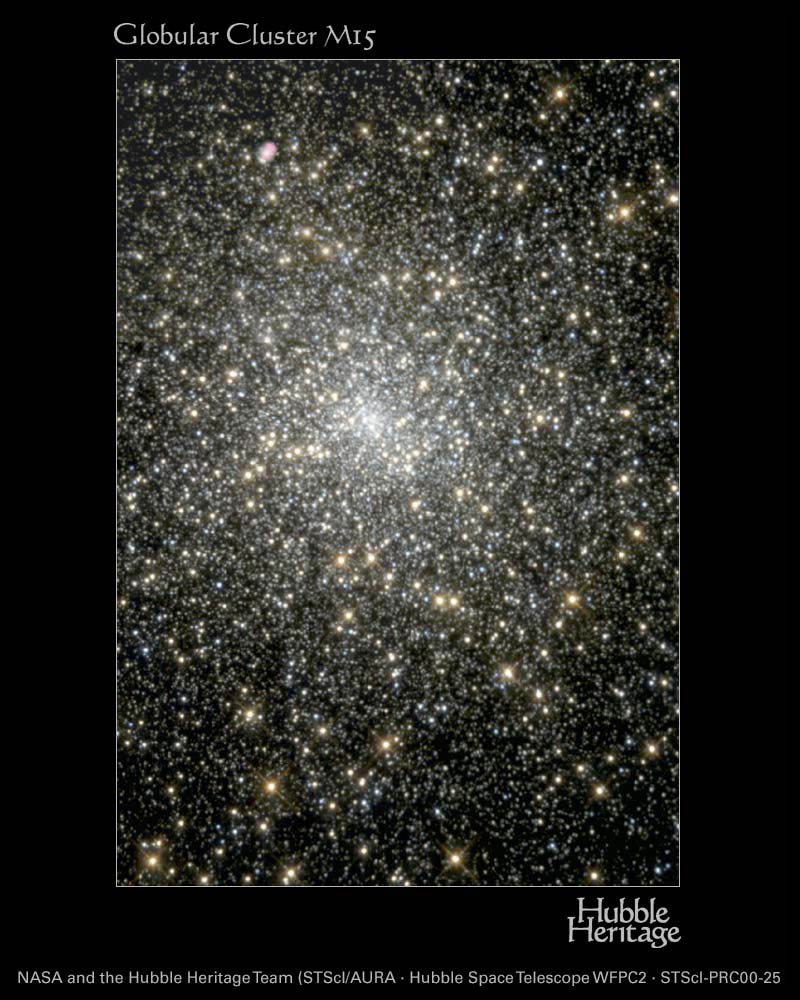 Globular cluster M15 in
Pegasus at
about 13 kpc.
Globular cluster M15 in
Pegasus at
about 13 kpc.
The image approximates true color.
The small pink nebula in the upper left is a planetary nebula discovered in a globular cluster (Pease 1928): there are still only a few other globular clusters.
Credit: NASA and The Hubble Heritage Team (STScI/AURA) Acknowledgment: H. Bond (STScI).